Binance Coin Price Analysis: BNB Eyes $14 Following Bitcoin’s Price Increase
- A break above the 4-hours triangle pattern would confirm a fresh uptrend for Binance Coin.
- BNB bulls are waiting to take over the market after pushing relentlessly from three weeks low
- Binance Coin is holding tight above two weeks support across its trading pairs
BNB/USD: BNB Waiting For Surge As Price Consolidates
Key Resistance Levels: $13.5, $14.3, $16.6
Key Support Levels: $11, $9.7, $8.3
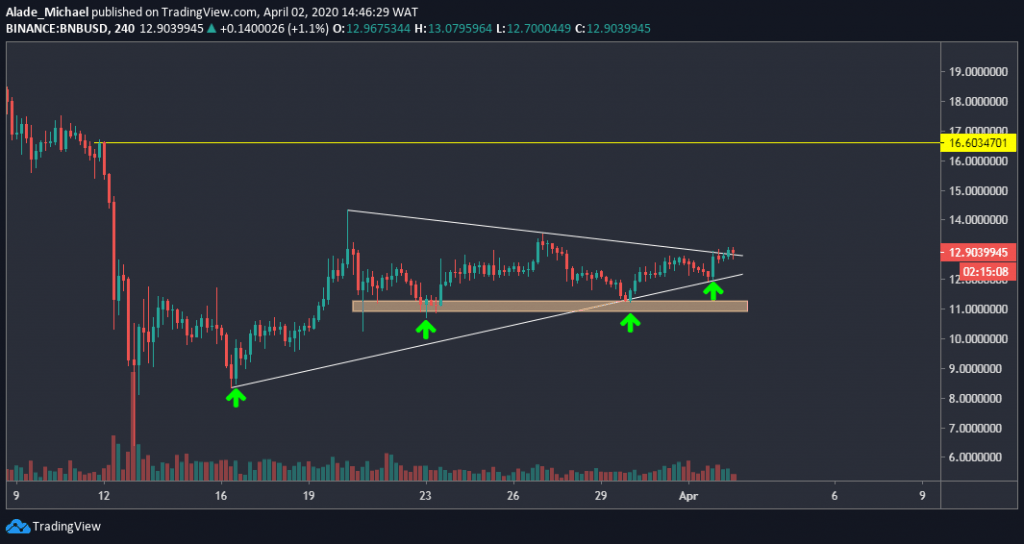
Since our previous price analysis, Binance Coin has seen a significant recovery after crashing to $6 in March. At the time of writing, BNB is trading at $12.8 per coin after recording 3.35% gains overnight.
This latest growth was followed by a sudden increase in Bitcoin’s price after dropping to $6170 yesterday.
From what can be seen so far, the bulls are back in the market. As shown on the 4-hours chart, the green arrows significantly indicate bullish footprints, which suggest an incoming uptrend.
Another sign for bullish action here is that trading has reached the tight apex of the symmetrical triangle, which indicates that a potential breakout lurks around the corner.
Binance Price Analysis
While Binance Coin remains trapped in a triangle, the closest resistance to watch for a breakup is $13.5 and $14.3. The major price range is located at $16.6 resistance, indicated yellow on the price chart.
On the downside, BNB is currently relying on the triangle’s support of $12 (where the price bounced back after yesterday’s drop). If BNB dips lower, there’s a close demand area at $11, which is marked orange.
A break below this demand area may cause a devastating drop to $9.7 and $8.3. From a technical perspective, the buyers have an upper hand than the sellers.
BNB/BTC: BNB Volatility Shrinks, But Breakout Is Imminent
Key Resistance Levels: 0.00197 BTC, 0.00213 BTC
Key Support Levels: 0.00183 BTC, 0.00167 BTC
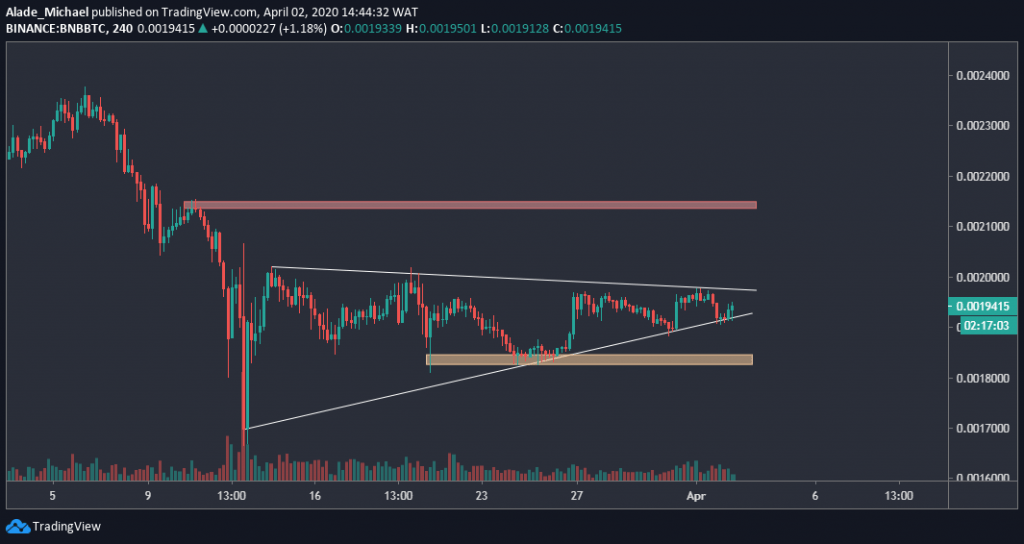
Following the latest price actions, Binance Coin is subjected to a sideways movement for the past few weeks. Although the bulls have shown a strong commitment to push the price all the way from 0.00165 BTC level. As of now, BNB is priced at 0.00193 BTC against Bitcoin.
As the price remains trapped in an ascending triangle, the volatility continues to shrink in a tight range to suggest an indecisive market.
Considering the previous recovery from 0.00183 BTC, 0.00189 BTC, and 0.00191 BTC, the price of BNB is likely to increase in the next few days. More so, the triangle pattern shows a sign of a positive movement.
However, there’s a need for a triangle breakout to determine the next actual direction of the market.
Binance Coin Price Analysis
Binance is currently eyeing a close resistance of 0.00197 BTC, around the upper boundary of the triangle. An increase above this resistance could allow further buy actions to 0.00213 BTC, indicated red on the price chart.
In the opposite direction, there’s mild support for Binance Coin at 0.00191 and 0.00189 BTC in case of a drop; but the major support to watch here is the 0.00183 BTC level, marked orange on the chart.
If the above support fails to contain selling pressure, the price could roll back to 0.00167 BTC (March’s low).
The post Binance Coin Price Analysis: BNB Eyes $14 Following Bitcoin’s Price Increase appeared first on CryptoPotato.