Binance Coin Price Analysis: BNB At 6-Month Lows, Struggles Against BTC As Well
BNB has been through a pretty stagnant week as the price bearly increased by 2%. The cryptocurrency is currently trading at resistance provided by the 100 day EMA but is failing to overcome this level. However, the market remains supported by a rising trend line as we wait to see if Binance Coin will break beneath.
Binance Coin remains the sixth-largest cryptocurrency with a market cap of $4.28 billion. The cryptocurrency has seen a 16% price decline over the past 30 days whilst BNB/BTC created fresh 6 month lows.
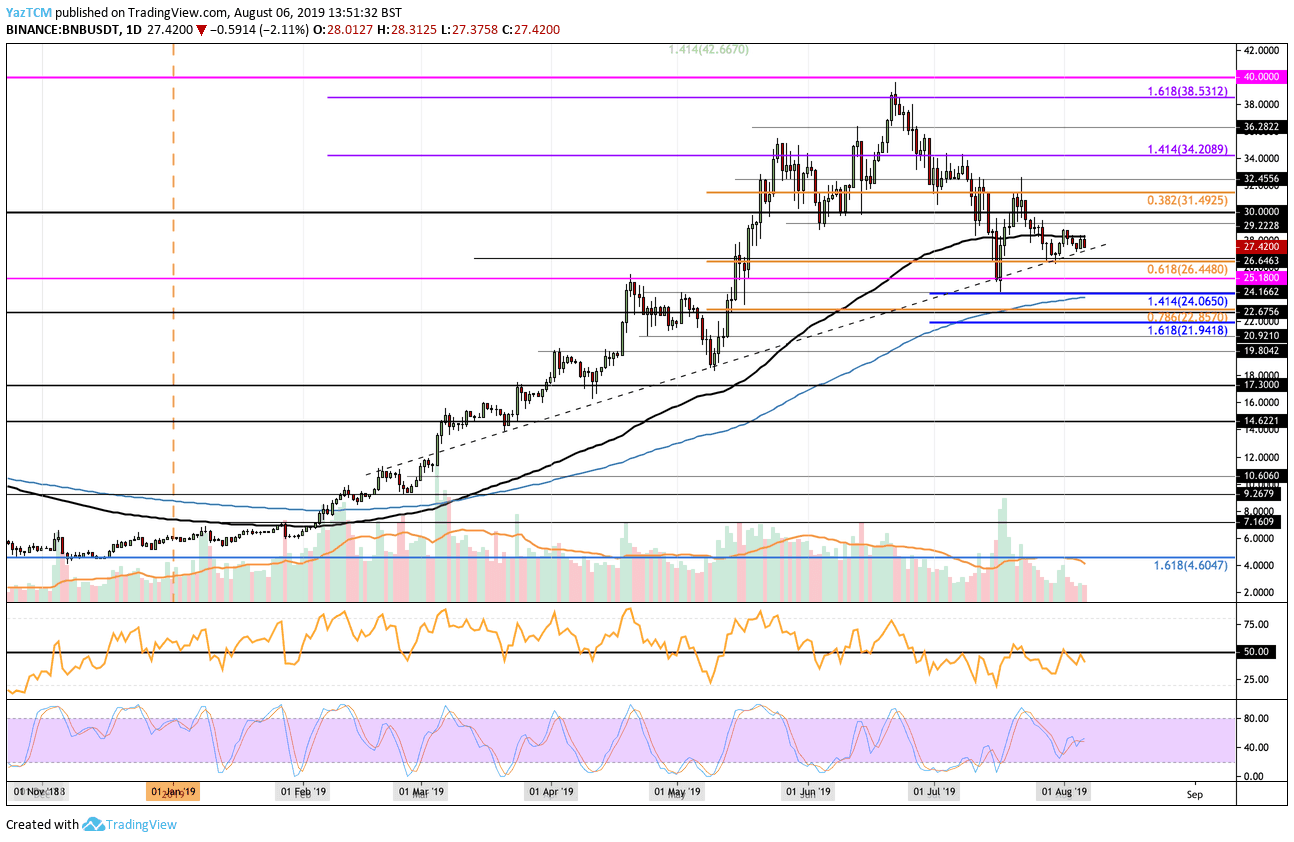
Looking at the BNB/USD 1-Day Chart:
- Since our previous BNB analysis, we can see that the resistance at the 100 days EMA has prevented the market from going higher whilst the rising support line continues to hold.
- From above: The nearest level of resistance lies at $28 which is provided by the 100 day EMA. Above this, higher resistance can be found at $29.22, $30, $31.49, and $32.45. If the bulls manage to bring BNB above $35, higher resistance is located at $36.28, $38, $38.53, and $40.
- From below: If the sellers push the market beneath the rising support line, immediate support toward the downside is located at $26.44 and $25.18. If the selling continues to drop the market beneath $25, strong support is expected at $24.06 which is further bolstered by the 200 days EMA. Beneath this, support is found at $22.85, $21.94, and $20.92.
- The trading volume has been falling during the first few days of August.
- The RSI had attempted to break above the 50 level but had failed to do so as the bulls remain in control of the market momentum.
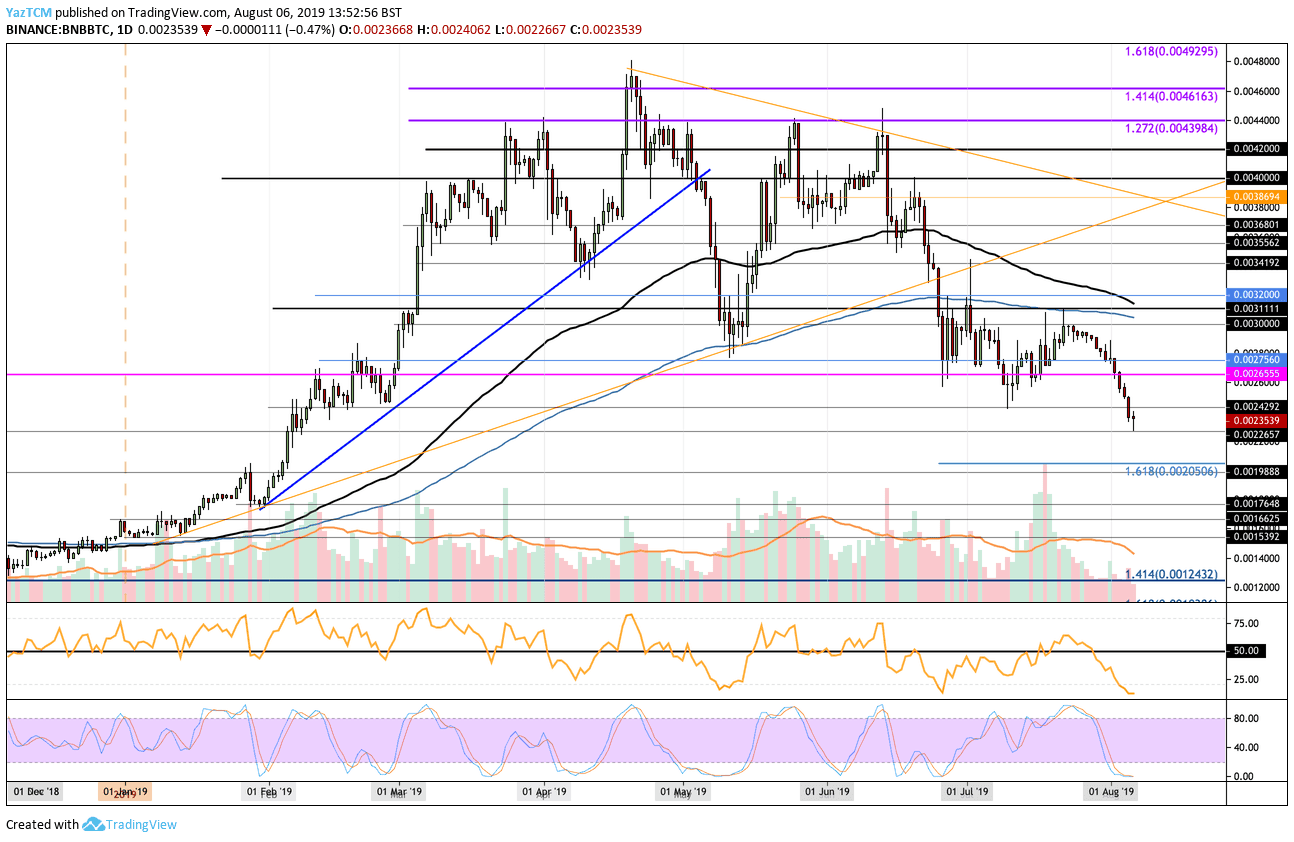
Looking at the BNB/BTC 1-Day Chart:
- Against Bitcoin, we can see that BNB has been struggling Since August 1st, it has declined by a total of around 15% after dropping through support at 0.0027 BTC and 0.002655 BTC to reach where it currently trades at around 0.002353 BTC.
- From above: The nearest level of resistance lies at 0.002492 BTC. Above this, higher resistance is found at 0.0026 BTC, 0.002655 BTC, and 0.002756 BTC. IF the bulls can continue to climb higher we can expect resistance at 0.003 BTC, 0.003111 BTC, and 0.00032 BTC.
- From below: The nearest level of support now lies at 0.002265 BTC. If the sellers push beneath this, the next levels of support are at 0.0022 BTC, 0.00215 BTC, and 0.0021 BTC. If the selling continues beneath 0.002 BTC we can expect support at 0.0018 BTC, 0.001764 BTC, and 0.001662 BTC.
- The trading volume remains well below average.
- The RSI has plummeted to extreme oversold conditions which could be a promising sign as it suggests the sellers should be exhausted. Furthermore, the Stochastic RSI trades in oversold conditions as we wait for a bullish crossover signal.
The post Binance Coin Price Analysis: BNB At 6-Month Lows, Struggles Against BTC As Well appeared first on CryptoPotato.