Binance Coin Price Analysis: BNB Above $20, Can The Bulls Keep It Going?
Binance Coin saw a slight increase of around 4% over the past 24 hours and it currently trades at $20.24. BNB managed to surge by a total of 20% this past week which caused it to break above the resistance at $20.
Binance Coin remains the seventh-largest cryptocurrency with a market cap of $3.15 billion.
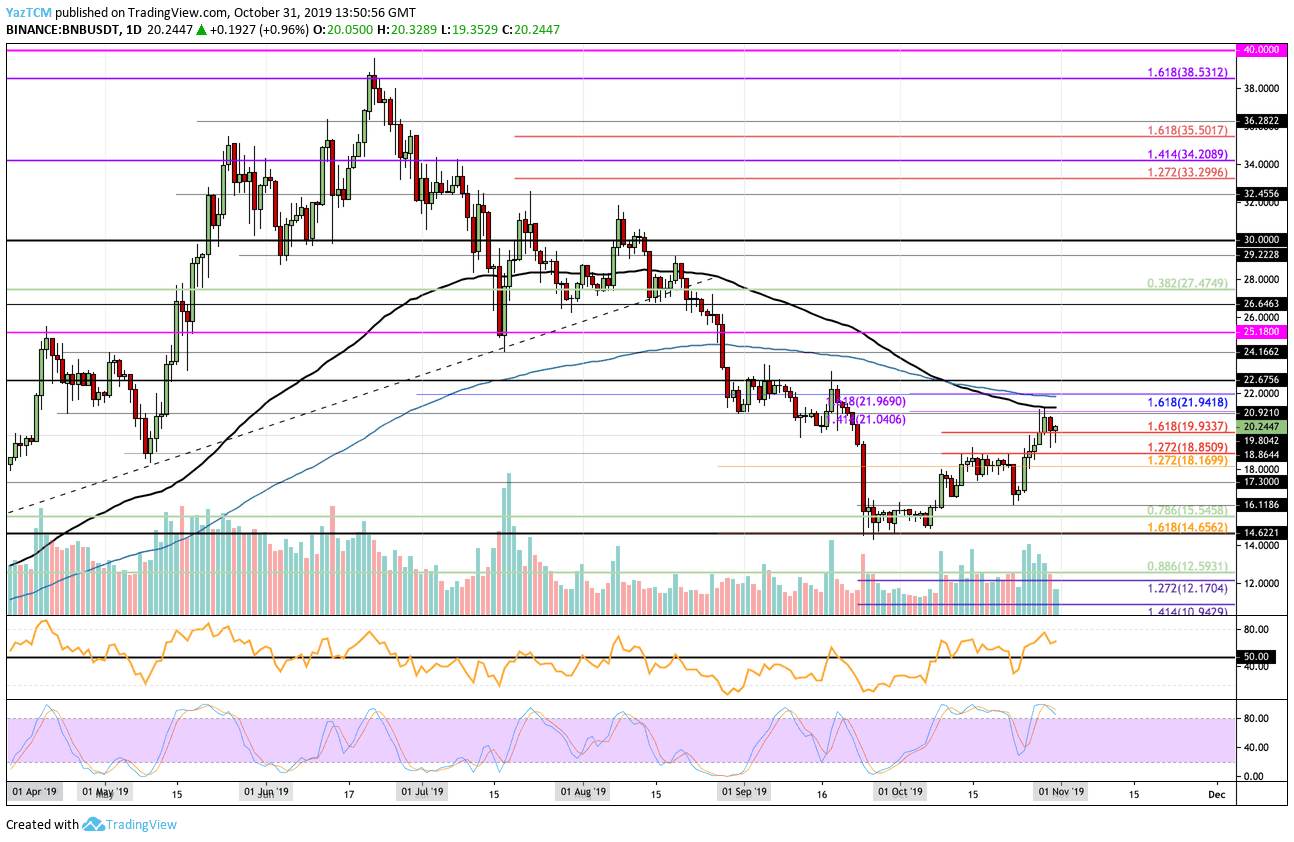
Looking at the BNB/USD 1-Day Chart:
- Since our previous BNB analysis, the cryptocurrency continued to climb above the resistance at $18.85 and managed to break above the $20 level. BNB continued to rise until meeting resistance at the 100-days EMA at around $21.10. This area of resistance is the August 2019 low.
- From above: The nearest level of resistance lies directly at $21.10 (100-days EMA). Above this, resistance is at $22.00 (200-days EMA), $22.67, $23, $14.16, $25.18, and $26.64.
- From below: The nearest level of support is found at $19.93. Beneath this, support lies at $18.85, $18.16, $17.30, $16.11, $15.54, and $14.65.
- The trading volume has been very high during October 2019 and remains high.
- The RSI is well above the 50 level as the bulls dominate the momentum, however, the Stochastic RSI has produced a bearish crossover signal that should send the market downward.
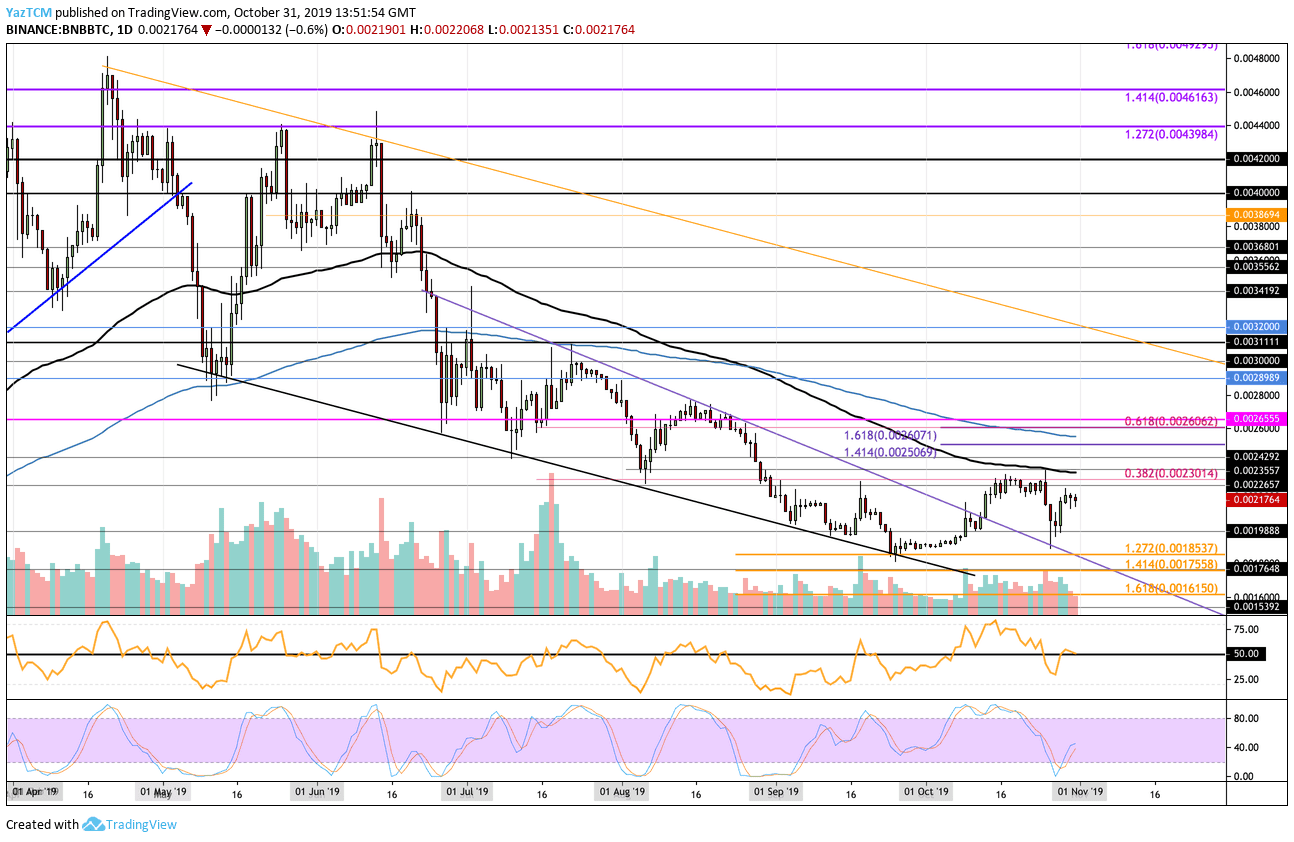
Looking at the BNB/BTC 1-Day Chart:
- Against Bitcoin, BNB fell further from the resistance at 0.0023 BTC but managed to find strong support at the 0.001988 BTC region, where we saw a rebound. BNB climbed higher to the current trading price of 0.00217 BTC.
- From above: The nearest level of resistance lies at 0.0023 BTC. Above this, resistance is located at 0.002340 BTC, 0.0025 BTC, 0.002506 BTC (1.414 Fib Extension), 0.002550 (200-days EMA), and 0.002607 BTC (1.618 Fib Extension).
- From below: The nearest levels of support lie at 0.0021 BTC and 0.0020 BTC. Beneath this, support lies at 0.001988 BTC, 0.0019 BTC, 0.001852 BTC, 0.0018 BTC, and 0.001755 BTC.
- The trading volume has also remained very high during October 2019.
- The RSI is battling the 50 level which shows indecision within the market. For a bullish run, we would need to see the RSI rise and climb further from the 50 level.
The post Binance Coin Price Analysis: BNB Above $20, Can The Bulls Keep It Going? appeared first on CryptoPotato.

