Binance Coin (BNB) Surges 13% To a New All-Time High Following Binance Launchpad Announcement: BNB Price Analysis
The Binance train is showing no signs of slowing down after a recent increase by another 12% over the past two hours, bringing the current trading around $17 (the highest since June 2018), and recording a new all-time high against Bitcoin. The cryptocurrency has now seen a 60% increase over the past 30 days and a further 175% increase over the past 90 trading days.
The recent surge is coming minutes after Binance had announced on a change of format to the Binance Launchpad token sale. From the next Launchpad sale, the sale will be managed as a lottery draw. This is probably the major lesson following the overwhelming demand to the previous Celer Network sale.
What’s the relation to BNB? Each user has to hold a decent amount of the coin in order to become eligible to participate in the Launchpad lotteries.
Binance Coin in now ranked in 7th position as it presently holds a $2.23 billion market cap valuation.
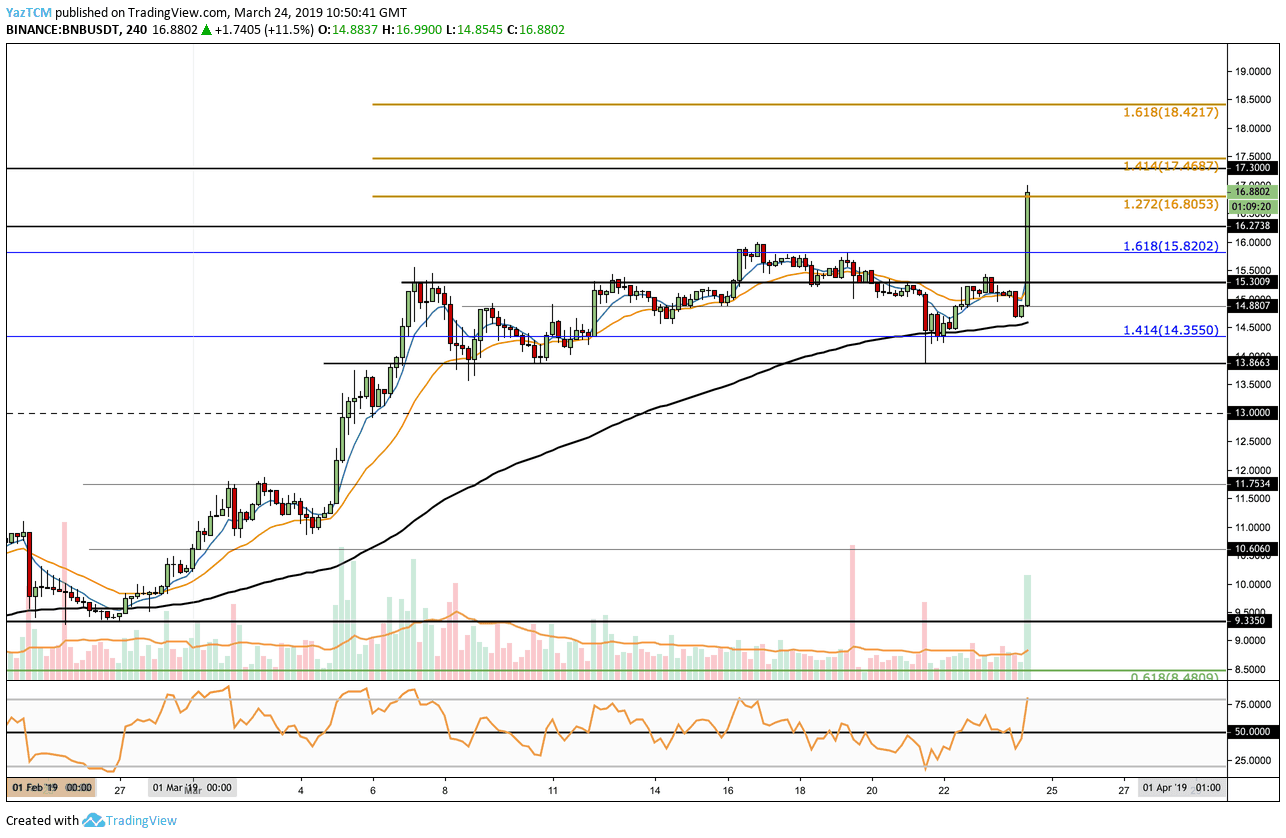
Looking at the BNB/USD 4-Hour Chart:
- Since our last BNB/USD price analysis, we can see that the market has surged above the previous level of resistance at $15.82 and has stormed even above $16.00. We can see that the coin has now reached intermediate resistance at $16.80 where lies a short term 1.272 Fibonacci Extension level (marked in gold).
- From above: The nearest level of resistance above lies at $17.30. This is then immediately followed with higher resistance at the 1.414 ($17.46) and the 1.618 ($18.42) Fibonacci Extension levels (drawn in gold).
- From below: The nearest level of support now lies at $16.27 followed by stronger support at $16.00. If the sellers push the market below $16.00, further support then lies at $15.82, $15.30 and $14.88. Beneath $14.88, we can conduct further support at $14.35 and then strong support at $13.86.
- The 4-hour chart’s RSI has surged into strong bullish territory above 50. If the RSI can remain above 50, we can expect Binance Coin to continue to create fresh 2019 highs.
- The trading volume as seen a significant increase in today’s trading session which more than doubles the average.
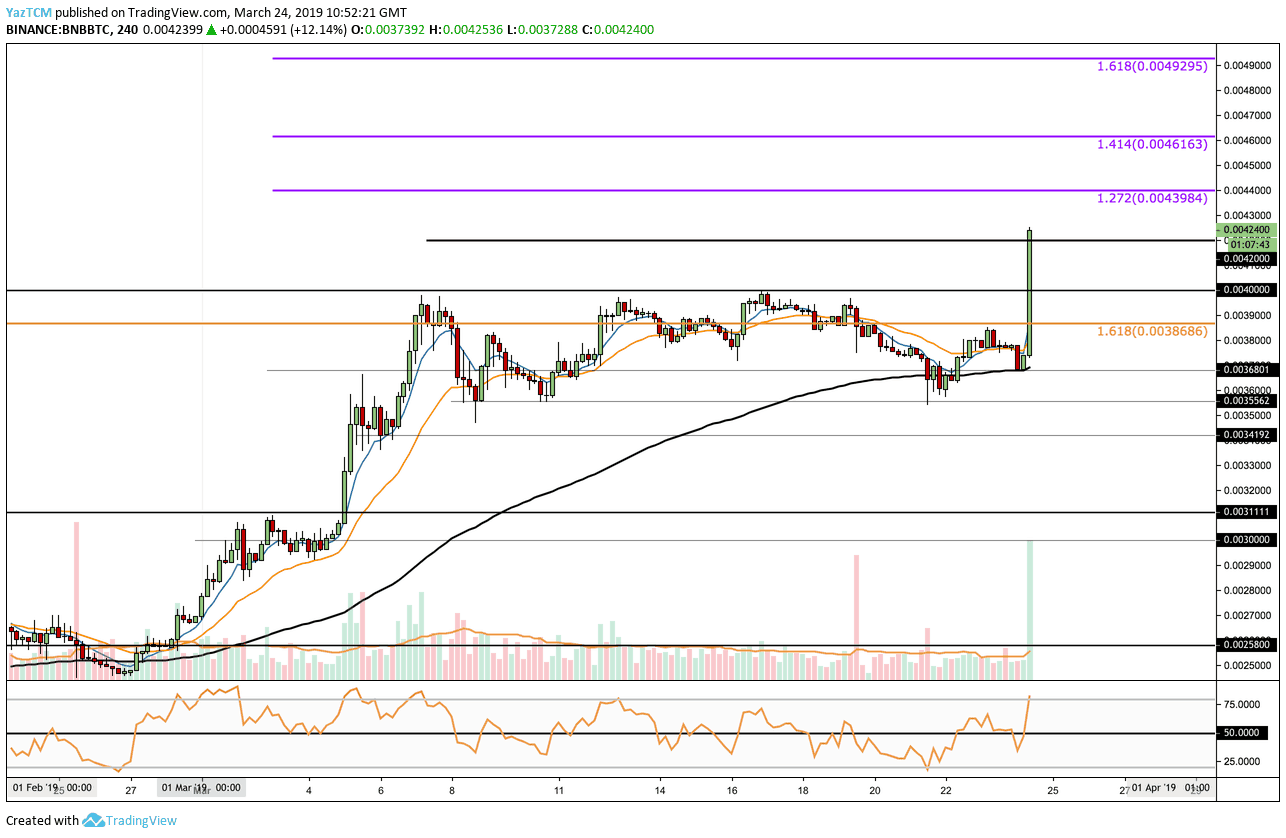
Looking at the BNB/BTC 4-Hour Chart:
- Following our previous BNB/BTC analysis we can see that the market has also broken above our previous highlighted significant level of resistance at 0.0040 BTC. The market continued to climb further higher and has recently penetrated more resistance at 0.0042 BTC.
- From above: The nearest level of resistance lies at 0.0044 BTC where lies the short term 1.272 Fibonacci Extension level. Above this, we can expect more resistance at the 1.414 (0.004616 BTC) and 1.618 (0.004925 0.005 BTC) Fibonacci Extension levels.
- From below: The nearest level of support now lies at 0.0040 BTC. Beneath lies resistance turned support levels at 0.003868 BTC, 0.003680 BTC and 0.003556 BTC.
- The 4-hour BTC chart’s RSI has also reached strong bullish conditions above 50 as buyers take control of the market momentum.
- The trading volume has also significantly surged today to more than double the market average.
The post Binance Coin (BNB) Surges 13% To a New All-Time High Following Binance Launchpad Announcement: BNB Price Analysis appeared first on CryptoPotato.