Binance Coin (BNB) Price Analysis: The Bulls Are Getting Closer To The 2019 High At $20 – a Breakout Or Double Top?
Once Bitcoin’s price had calmed down a bit, the bulls have started to wake up for Binance Coin as BNB increases by a further 4.35% over the past 24 hours, bringing the current price for the coin above $19.00. The cryptocurrency has seen a 26% increase over the past 30 days with a further, very impressive, 218% price surge over the past 90 days (and still 10% far from its all-time high).
Binance Coin remains in 7th place on the top cryptocurrencies by market-cap as it holds a $2.71 billion market cap value.
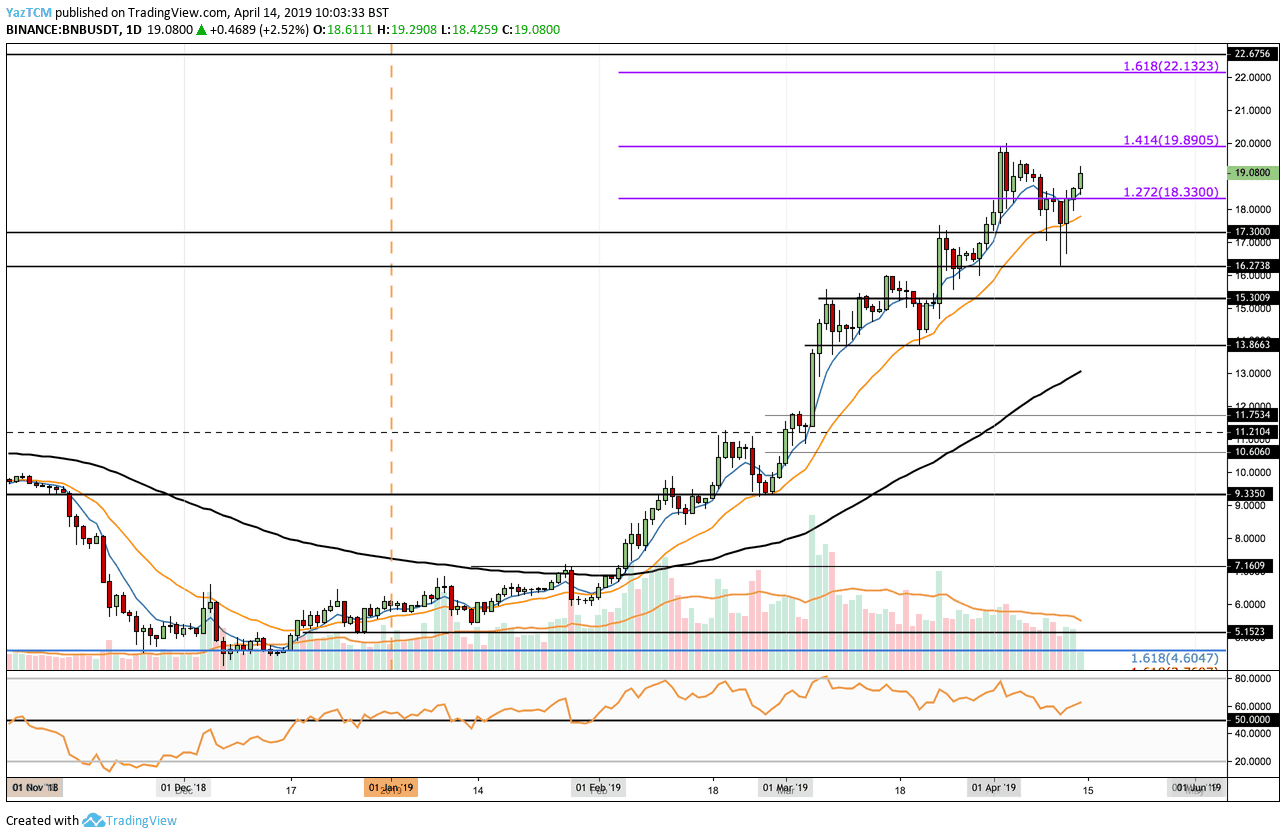
Looking at the BNB/USD 1-Day Chart:
- Since our last BNB/USD price analysis, we can see that the market had fallen right into the mentioned support at the $17.30 level. The coin had spiked lower into further support below at $16.27, but this was very short lived. Binance Coin has now risen back breaking up the $18.30 level of resistance as it is currently trading at $19.08.
- From above: The nearest level of resistance is located at the $19.90 – $20 area where lies the 1.414 Fibonacci Extension level (drawn in purple) priced at $19.89. This had marked the previous level of resistance on the beginning of April, and it’s not going to be easy to break up that zone. Higher resistance then lies at $21.00 and $22.13, where lies the 1.618 Fibonacci Extension level.
- From below: The nearest level of support now lies at $18.30. Below, further support lies at $17.30, $16.27 and $15.30.
- The trading volume remains above average but has started to show some signs of declining, might be due to the weekend.
- The RSI has recently bounced above the 50 level which indicates that the bulls are still in control of the market momentum.
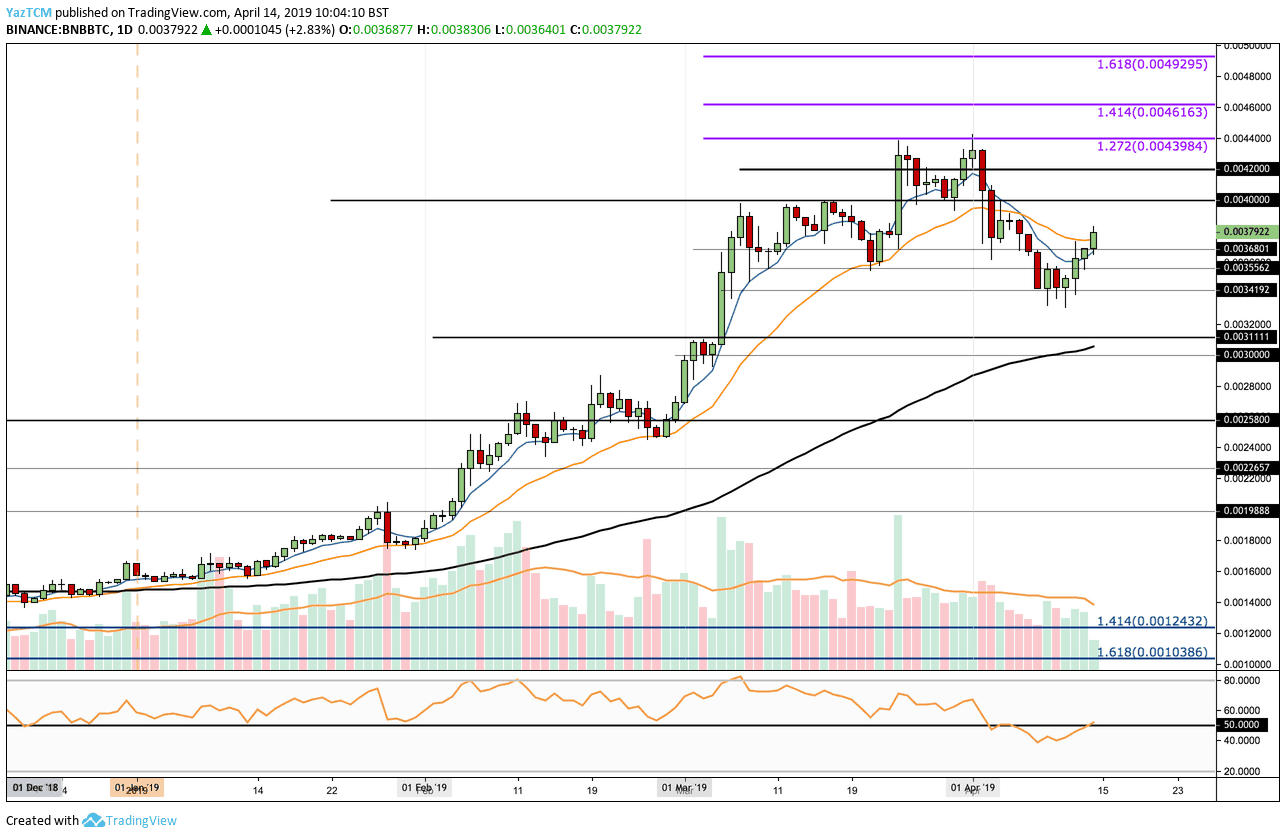
Looking at the BNB/BTC 1-Day Chart:
- Following our previous BNB/BTC analysis, we can see that BNB/BTC had also held strong at our mentioned support around the 0.00341 BTC level. The market has now rebounded and trades around 0.0038 BTC.
- From above: The nearest level of resistance now lies at 0.0040 BTC. Above this, further resistance can be expected at 0.0042 BTC and 0.0044 BTC, where lies a short term 1.272 Fibonacci Extension level. Above 0.0044 BTC, higher resistance can be expected at 0.0046 BTC (1.414 Fib Extension) and 0.004930 BTC (1.619 Fib Extension).
- From below: The nearest level of support now lies at 0.003680 BTC. Further support lies at 0.003560 BTC and 0.003420 BTC, before reaching the 0.003 – 0.003111 BTC area (along with the 100 days moving average line).
- The trading volume remains above average but has also seen some signs of decreasing over the past 4-5days.
The post Binance Coin (BNB) Price Analysis: The Bulls Are Getting Closer To The 2019 High At $20 – a Breakout Or Double Top? appeared first on CryptoPotato.