Binance Coin (BNB) Is Unstopable: Becomes The 7th Largest Crypto Following 100% Monthly Gains. This Could Be The Reason
Binance Coin has continued to thunder rising another 13% over the past 24 hours of trading, reaching an imaginary new all-time high against the Bitcoin at 0.004 BTC per coin.
The cryptocurrency is now trading for $15 and has outperformed the entire top 20 cryptocurrencies over the past year. While Bitcoin had decreased 65% over the last year, BNB is now 51% up dollar-wise on the annual return (!).
Over the past few months, we have witnessed BNB begin to deviate away from the trend set out by Bitcoin. During February and March, we have seen this deviation increase substantially to the point where now we can consider Binance to be uncorrelated to Bitcoin. This pretty much makes BNB the only coin that has been able to break away from its ties to the Bitcoin trend and correlation.
Binance Coin has now ascended into the 7th ranked position of the leading cryptocurrencies by market cap, as it holds a $2.14 billion market cap value.
Is BNB the ETH of 2017?
The year of 2017 was fantastic for the crypto markets, led by Bitcoin with 20x gains, while many altcoins gained even more: Of the major ones, Ethereum had outperformed, as it became the “coin of the ICOs.” Thanks to the Ethreum blockchain based ERC-20 token mechanism, projects could easily raise funds in ETH via their ERC-20 ICO smart contracts.
We do identify some similarities between BNB of 2019 to ETH of 2017, whereas BNB is the coin used to participate in fundraising events taking place on Binance Launchpad. Following two successful fundraising events, Binance is looking forward to March Celer Network fundraising.
Another similarity is the negative correlation to Bitcoin. During 2017, when BTC moved up, altcoins moved down and vice versa. Some altcoins, such as Ethereum, had the highest inverse correlation in comparison to Bitcoin. In 2018, mostly there was a positive correlation between Bitcoin and the altcoins. Over the recent month, we can definitely see such inverse correlation between BNB and BTC.
BNB Price Analysis
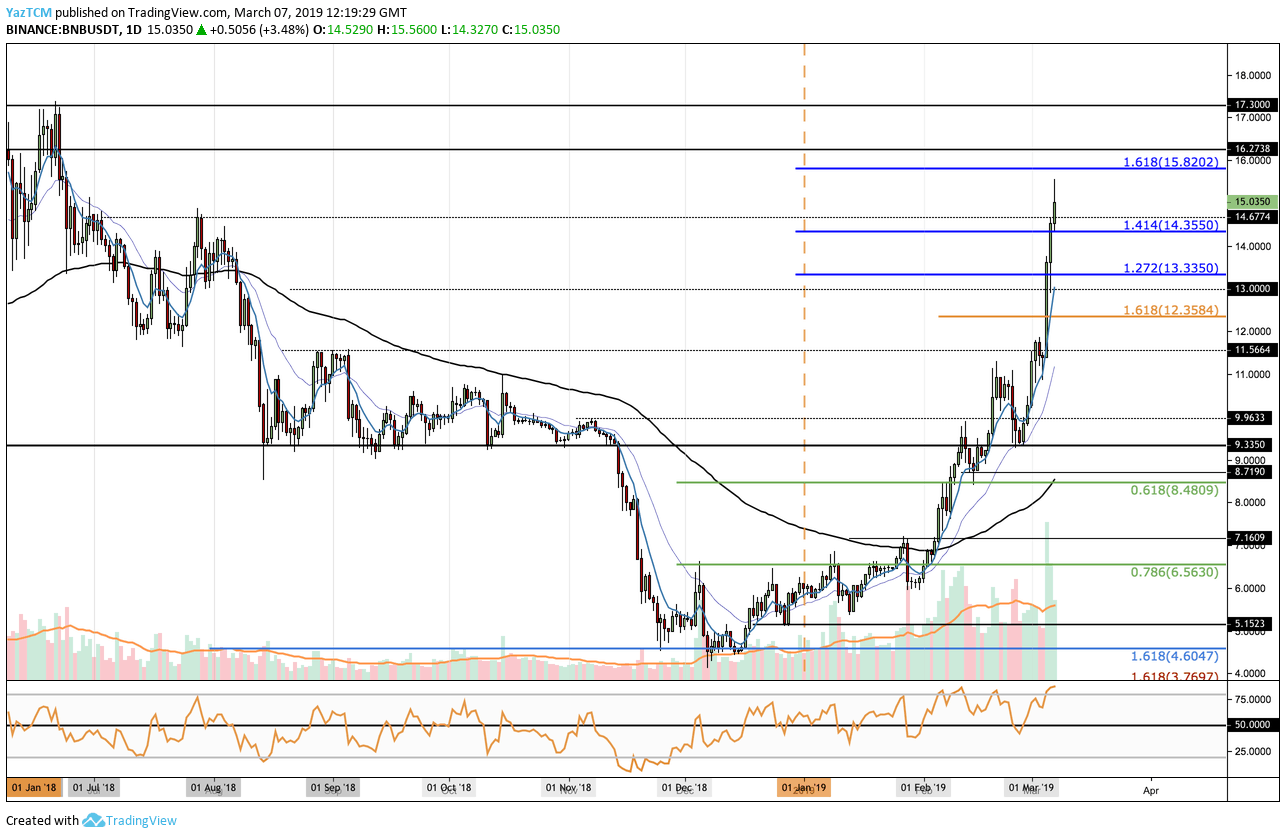
Looking at the BNB/USD 1-Day Chart:
- Since our previous Binance Coin analysis, price action has surged above the previous resistance highlighted at the $13.35. The bulls continued to push further above the resistance of $14.35 and have managed to penetrate above $15.00 for the first time in 8 months.
- From above: The nearest resistance lies at $15.82 where the 1.618 Fibonacci Extension level is located. Further higher resistance then lies at $16.27 and $17.00. If the bulls break above $17.00, we can expect BNB/USD to head toward $20.
- From below: The nearest support lies at $14.35. Support beneath this lies at $13.35, $13.00 and $12.35. IF the sellers push BNB/USD below $12.00, further support lies at $11.56 and $10.00.
- The RSI is in overbought conditions which could indicate a brief pullback, which may be healthy.
- The trading volume continues to break records, and increased substantially during March.
Looking at the XRP/BTC 1-Day Chart:
- BNB/BTC has now broken above our previous resistance at 0.00353 BTC. The market has continued to climb into resistance at 0.003868 BTC as the bulls attempt to break above 0.0040 BTC as the next target.
- From above: The nearest resistance beyond 0.0040 BTC lies at 0.0042 BTC. Further resistance above lies at the short term 1.272 (0.004398 BTC) and the 1.414 (0.004613 BTC) Fibonacci Extension levels.
- From below: The nearest support lies at 0.0038 BTC. Support beneath this is then expected at 0.00353 BTC, 0.00340 BTC, and 0.00311 BTC.
- The RSI has also reached overbought conditions which may indicate a small retracement is coming soon.
- The trading volume has remained consistently high.

The post Binance Coin (BNB) Is Unstopable: Becomes The 7th Largest Crypto Following 100% Monthly Gains. This Could Be The Reason appeared first on CryptoPotato.

