Binance Coin (BNB) Breaks The All-Time High Following a 9% Surge – Price Analysis Mar.1
Binance continues to storm ahead following breaking up above the $10 mark and retesting the 2019 highs. The market has increased a further 9% over the past 24 hours, sending the BNB price up to $11.30 at the time of writing. Against Bitcoin, BNB had recently marked a new all-time high at current level.
Binance is currently ranked in the 9th position as it holds a $1.6 billion market cap value, the highest position for the coin on the top cryptos by market cap.
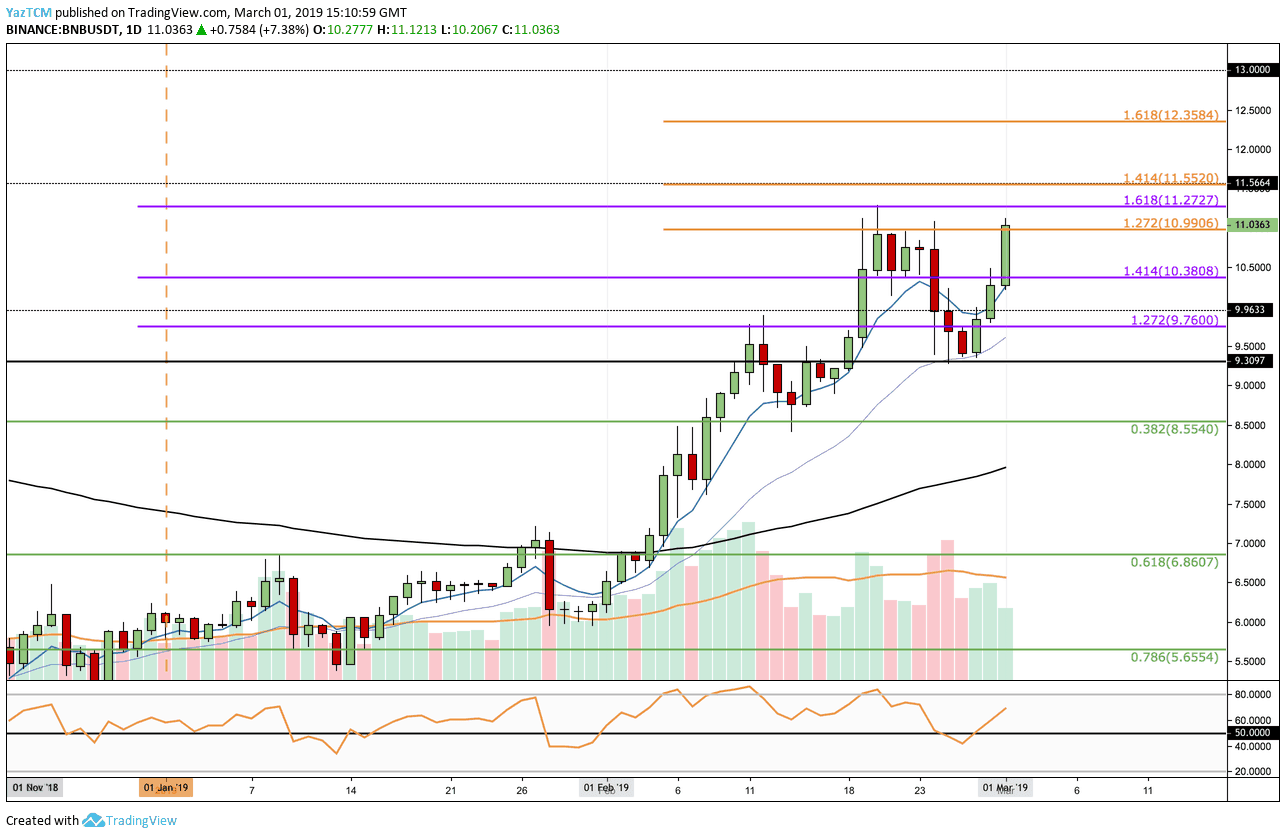
Looking at the BNB/USD 1-Day Chart:
- Immediately following our previous BNB analysis, we can see that the market had continued to drop to retest support level around $9.30. This area of support includes the significant 21-day EMA.
- Price action has since bounced back and has managed to surge above $10 (again) up to resistance at the short term 1.272 Fibonacci Extension level at $11 (marked in orange).
- From above: If the bulls continue higher above $11.00, the next levels of resistance lie at the $11.27 (current level and medium term 1.618 Fib) and $11.55 (short term 1.414 Fib) resistance levels. Further resistance above is located at $12.00 followed by $12.35 (short term 1.618 Fib).
- From below: The closest support lies at $10.38 and $10.00. Below $10.00 the next support is located at $9.30 and $9.00, as well as the .382 Fibonacci Retracement level at $8.55 (drawn in green).
- The RSI has broken back up above the bullish 50 zone.
- The trading volume has remained consistently high.
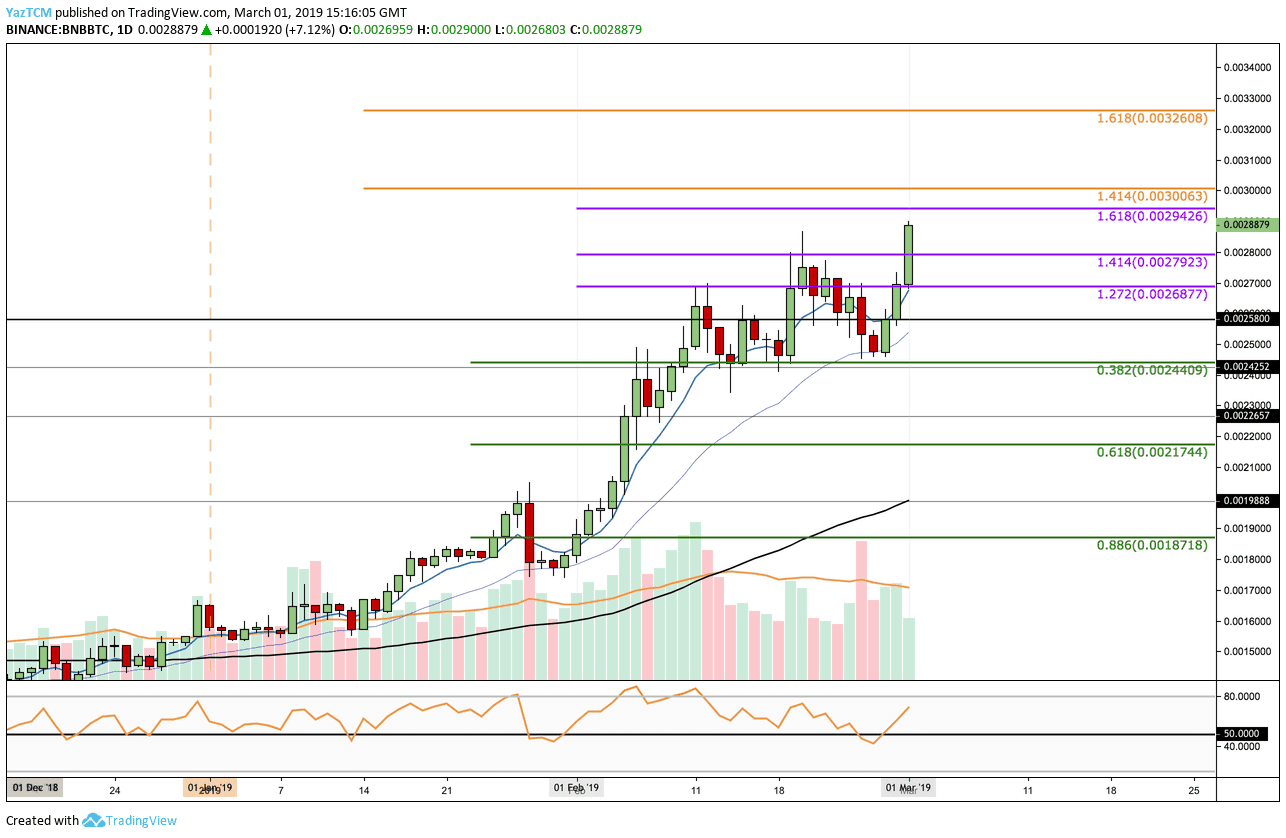
Looking at the BNB/BTC 1-Day Chart:
- BNB/BTC had fallen into support around the short term .382 Fibonacci Retracement level at 0.0024409 BTC (drawn in green), following our previous analysis.
- The coin has rebounded from there and managed to break above the previous resistance at the short term 1.414 Fibonacci Extension level located at 0.00280 BTC to its new all-time high.
- From above: The next resistance lies at the 0.0030 BTC level. A break-up can send BNB to higher resistance at the 0.0031 BTC level followed by resistance at the 1.618 Fibonacci Extension level at 0.003260 BTC (drawn in orange).
- From below: The closest support lies at resistance turned support 0.0029 BTC, 0.002687 BTC and 0.00258 BTC. Further support beneath lies at 0.002452 BTC and 0.0023 BTC.
- The RSI is bullish territory above 50.
- The trading volume is relatively high.
The post Binance Coin (BNB) Breaks The All-Time High Following a 9% Surge – Price Analysis Mar.1 appeared first on CryptoPotato.