Binance Coin Analysis: BNB Skyrockets 23% Weekly to a New ATH Around $680
BNB/USD – Bulls See Fresh ATHs Above $600
Key Support Levels: $640, $600, $573
Key Resistance Levels: $680, $700, $710
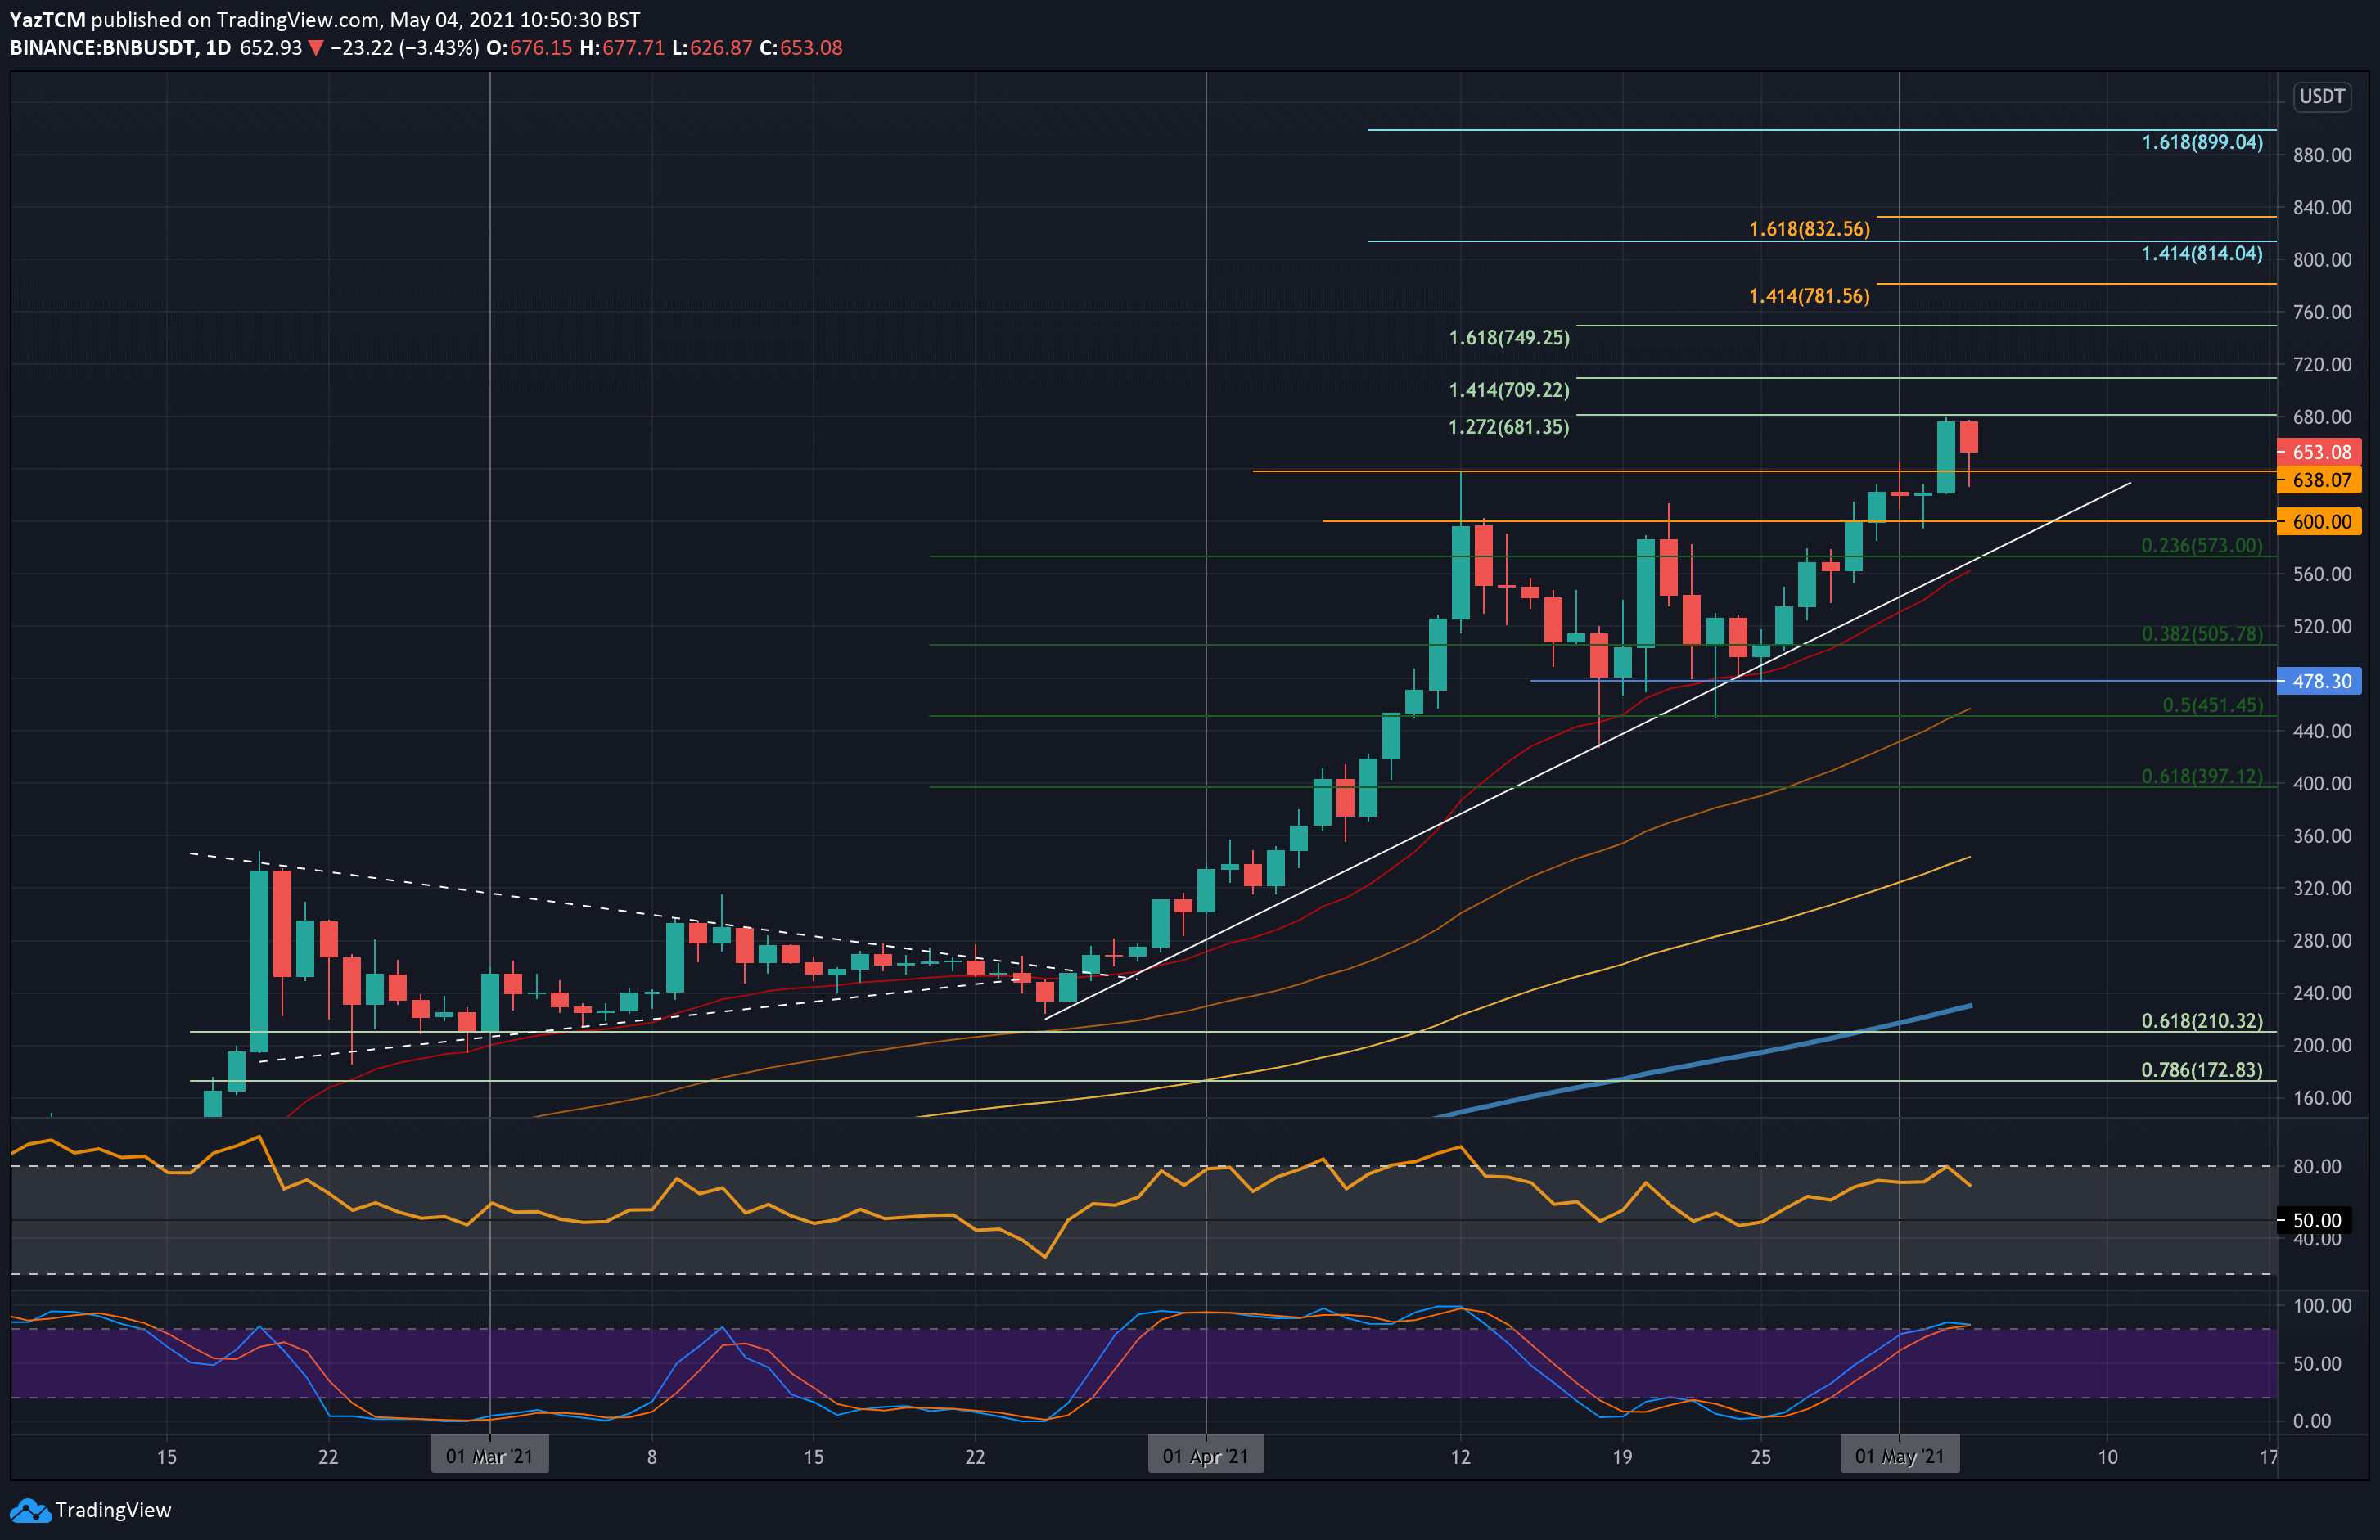
BNB is up by a strong 23% this week, setting a new ATH near $680. The coin was trading inside an ascending triangle during April with the roof at $600. It was penetrated on the final day of April after closing above $600.
Since then, BNB continued to climb higher. Initially, it found resistance at $640, but this was penetrated yesterday as the cryptocurrency set a new ATH near $680. There it found resistance at a short-term 1.272 Fib Extension and has since rolled over to the current $650 level.

BNB-USD Short Term Price Prediction
Moving forward, the first resistance lies at $680 (short term 1.272 Fib Extension). This is followed by $700, $710 (short term 1.414 Fib Extension), $750 (short term 1.618 Fib Extension), $781 (1.414 Fib Extension), and $800.
On the other side, the first support lies at $640. This is followed by $600, $573 (.236 Fib), $560 (20-days MA), $506 (.382 Fib), and $478.
The RSI reached near overbought conditions and has started to point lower, indicating the bullish momentum is no longer increasing. Additionally, the Stochastic RSI is primed for a bearish crossover signal that might see the market retracing back toward $600.
BNB/BTC – Bulls Set Highs Just Shy Of 0.012 BTC
Key Support Levels: 0.011 BTC, 0.0105 BTC, 0.01 BTC.
Key Resistance Levels: 0.0121 BTC, 0.013 BTC, 0.0135 BTC.
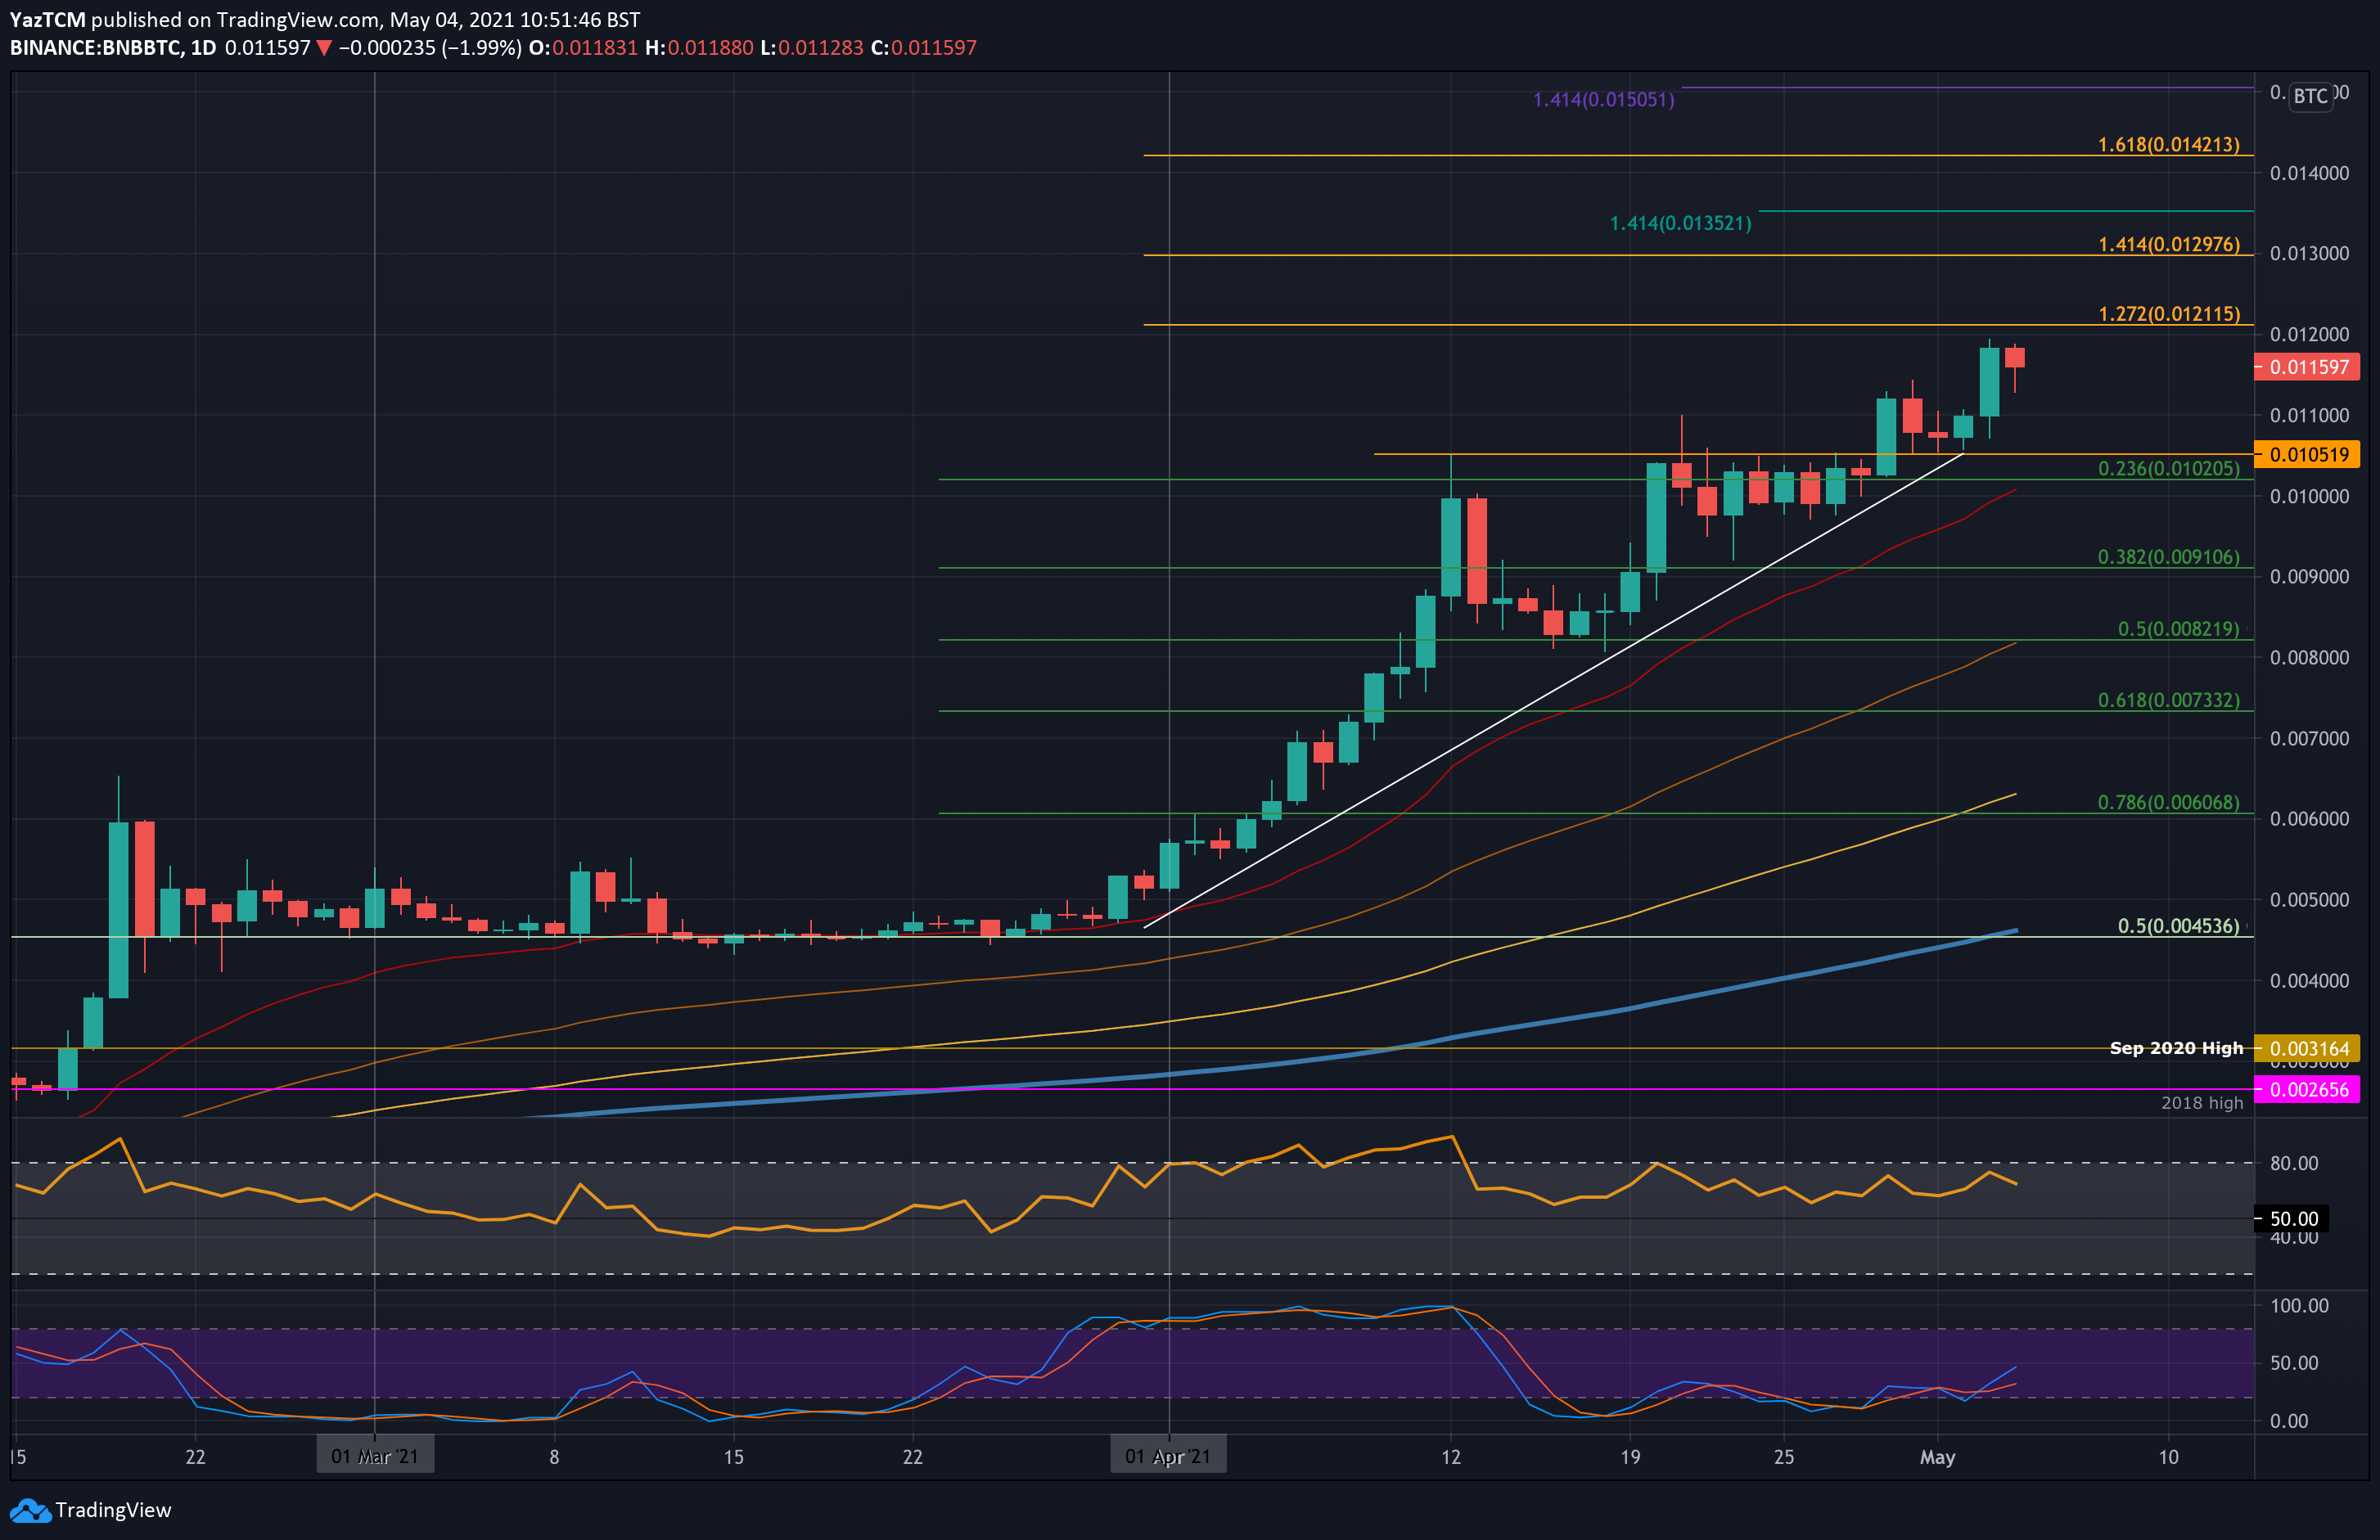
BNB is also outperforming bitcoin after setting new highs yesterday. The coin found resistance at 0.0105 BTC during April but finally penetrated above it in the final days of the month.
In early May, BNB dropped back into the 0.0105 BTC support before rebounding from there on Sunday. Yesterday, it broke 0.011 BTC to set a new ATH price just shy of 0.012 BTC.

BNB-BTC Short Term Price Prediction
Looking ahead, the first resistance lies at 0.0121 BTC (1.272 Fib Extension). This is followed by 0.013 BTC (1.414 Fib Extension), 0.0135 BTC (1.414 Fib Extension – blue), and 0.014 BTC.
On the other side, the first support lies at 0.011 BTC. This is followed by 0.0105 BTC, 0.01 BTC (.236 Fib & 20-days MA), and 0.0091 BTC (.382 Fib).
The RSI is also starting to head lower but remains strongly in the bulls’ favor. The Stochastic RSI seems to be in a strong position for BNB to continue rallying against bitcoin.


