Bears Take Control as SOL Crashes 10% in a Week, is $26 Incoming? (Solana Price Analysis)
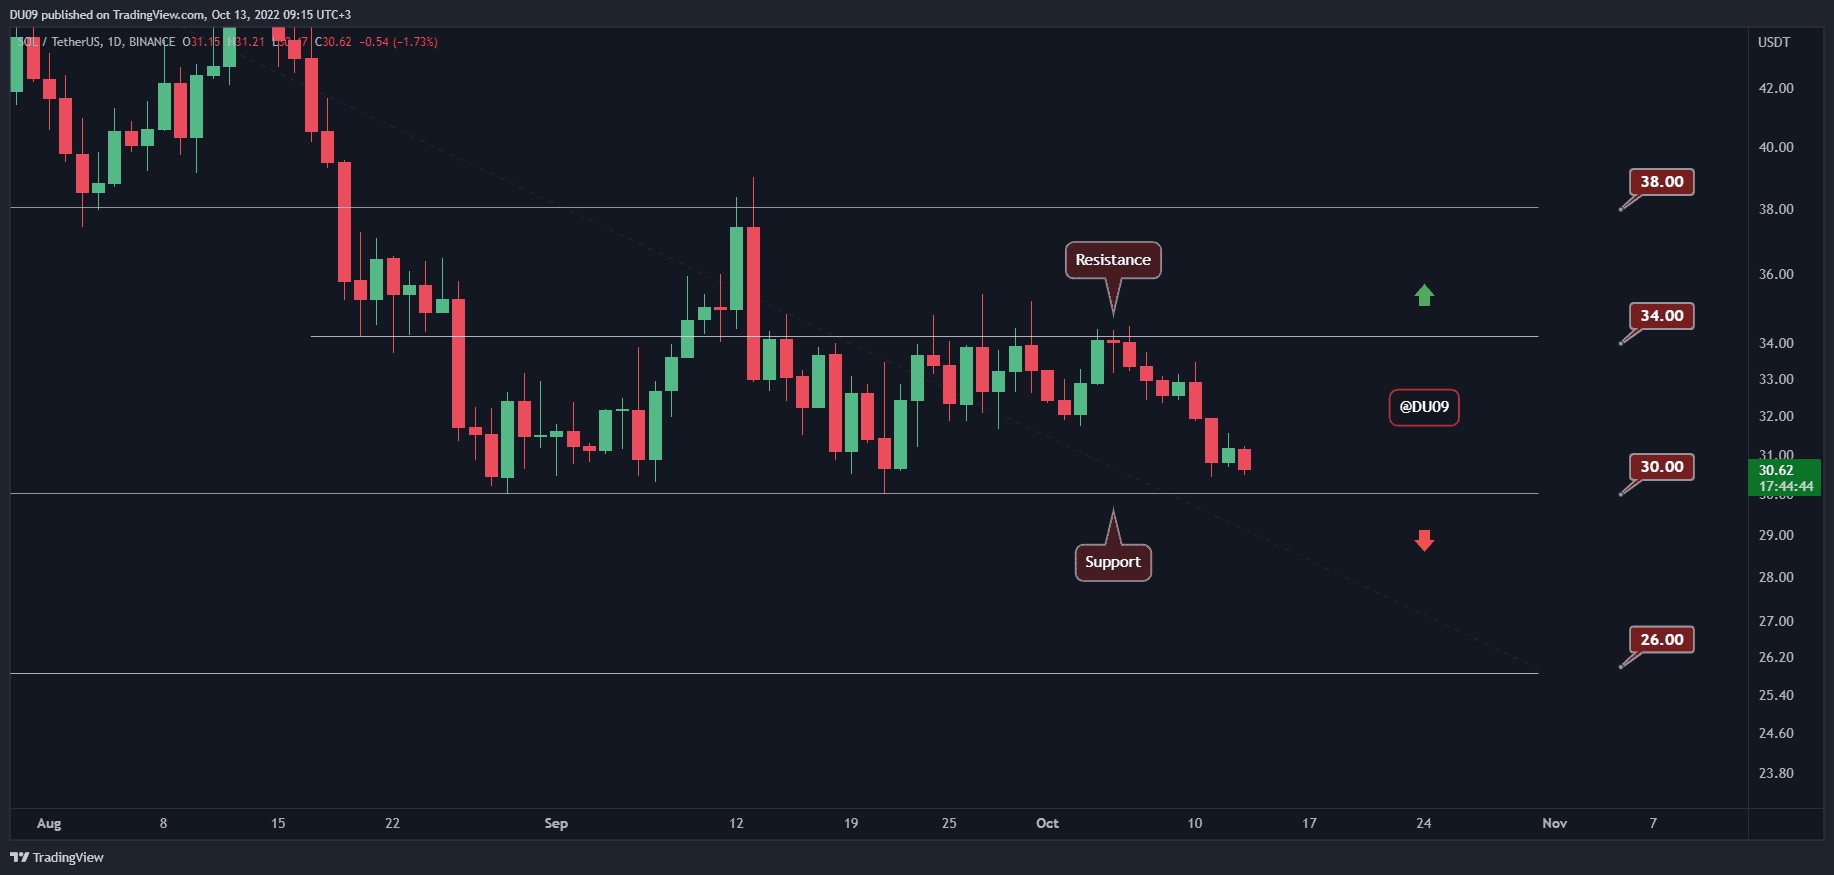
After a flat trend for over two months, Solana returned to the bottom of its current channel. It appears that the resilience of the bulls will soon be put to the test.
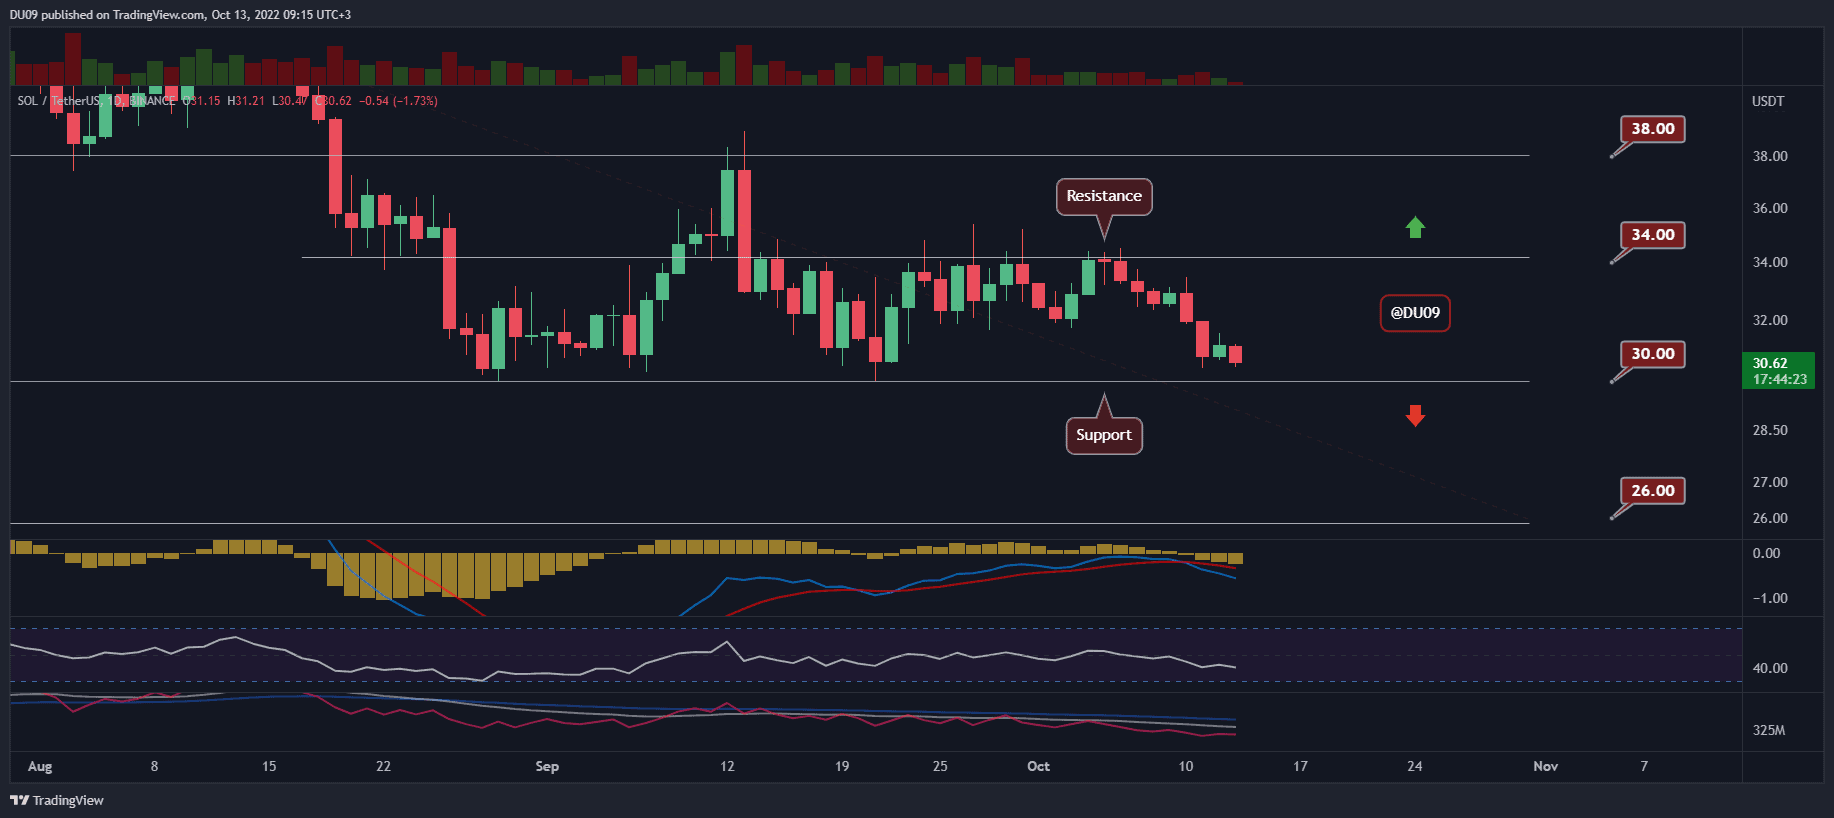
Key Support level: $30, $26
Key Resistance level: $34, $38
Solana’s price fell to $30, which is a critical support. If the sellers break this level, then the cryptocurrency will end its two months of consolidation and fall lower with the next key level of support at $26. The current resistance levels are $34 and $38. With bears in control of the price action, Solana will have a difficult time defending itself.
Technical Indicators
Trading Volume: The daily volume continues to decline. Market participants show a lack of interest at this time.
RSI: The daily RSI fell under 50 points and made a lower low. This puts Solana into a downtrend.
MACD: The daily MACD painted a bearish cross three days ago. This signals that the support at $30 may soon be under a lot of pressure from sellers.
Bias
The bias for SOL is bearish.
Short-Term Prediction for SOL Price
If buyers fail to defend Solana at the $30 support, then the price is likely to fall to $26. The current trend is bearish, and sellers appear to have the upper hand. If bulls cannot reverse this price action soon, then Solana’s downtrend will continue.
The post Bears Take Control as SOL Crashes 10% in a Week, is $26 Incoming? (Solana Price Analysis) appeared first on CryptoPotato.


