Bears Seem in Control, Is DOT About to Drop Toward $6.5? (Polkadot Price Analysis)
A constant consolidation near the substantial resistance region of $7.4 indicates an ongoing battle between Polkadot buyers and sellers.
Nevertheless, the market is in a critical spot, with the upcoming price action shedding light on DOT’s future prospects.
Technical Analysis
By Shayan
The Daily Chart
A detailed examination of Polkadot’s daily chart reveals an uncertain market state, as the price has been hovering around a crucial resistance marked by the $7.4 level and the significant 100-day moving average. Additionally, the RSI indicator has been consolidating near the 50 threshold, signifying a balance between buyers and sellers in the market.
Currently, the market is in a decisive position, with participants expecting a short-term rejection towards the $6.5 threshold. However, an unexpected surge above this critical resistance region could trigger a massive short-squeeze, increasing bullish momentum.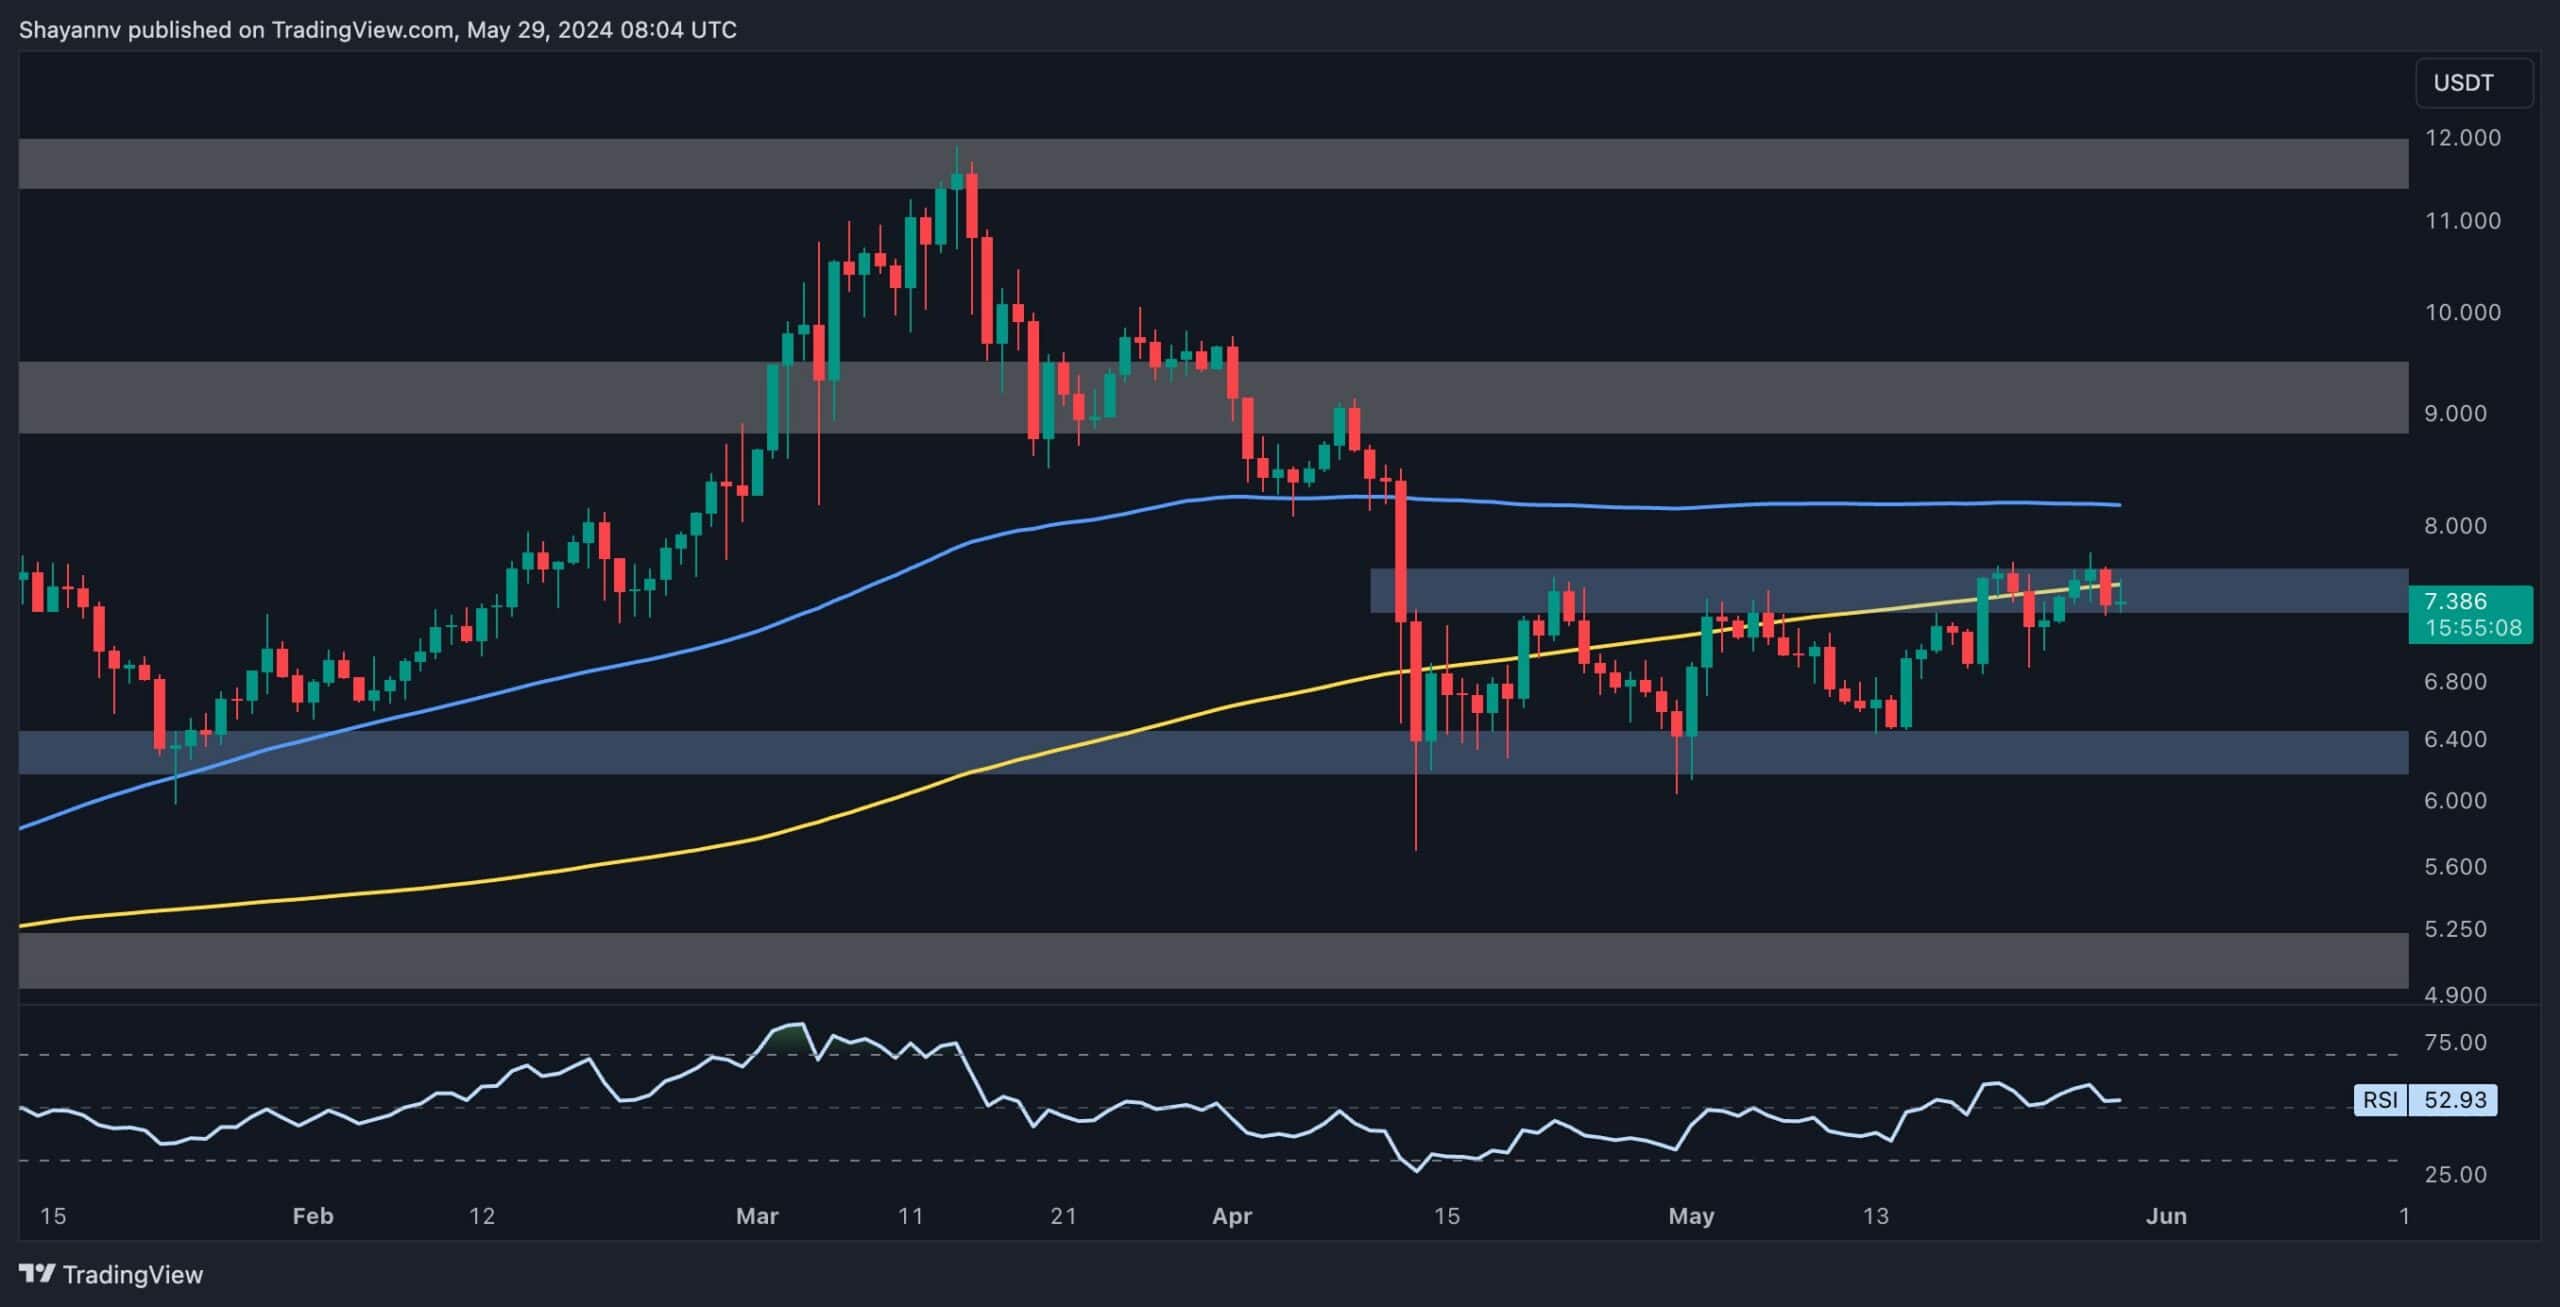
The 4-Hour Chart
The 4-hour chart shows a prolonged, slight ascent, with the price forming an ascending wedge pattern. This well-known pattern, following a steep decline, typically indicates a potential continuation of the initial bearish trend if breached from its lower boundary.
Currently, DOT is struggling with substantial resistance, bounded by the 0.5 ($7.4) and 0.618 ($7.6) Fibonacci retracement levels, failing to surpass them. Given the muted price action and lack of bullish momentum, Polkadot is expected to experience a pullback, targeting the pattern’s lower boundary.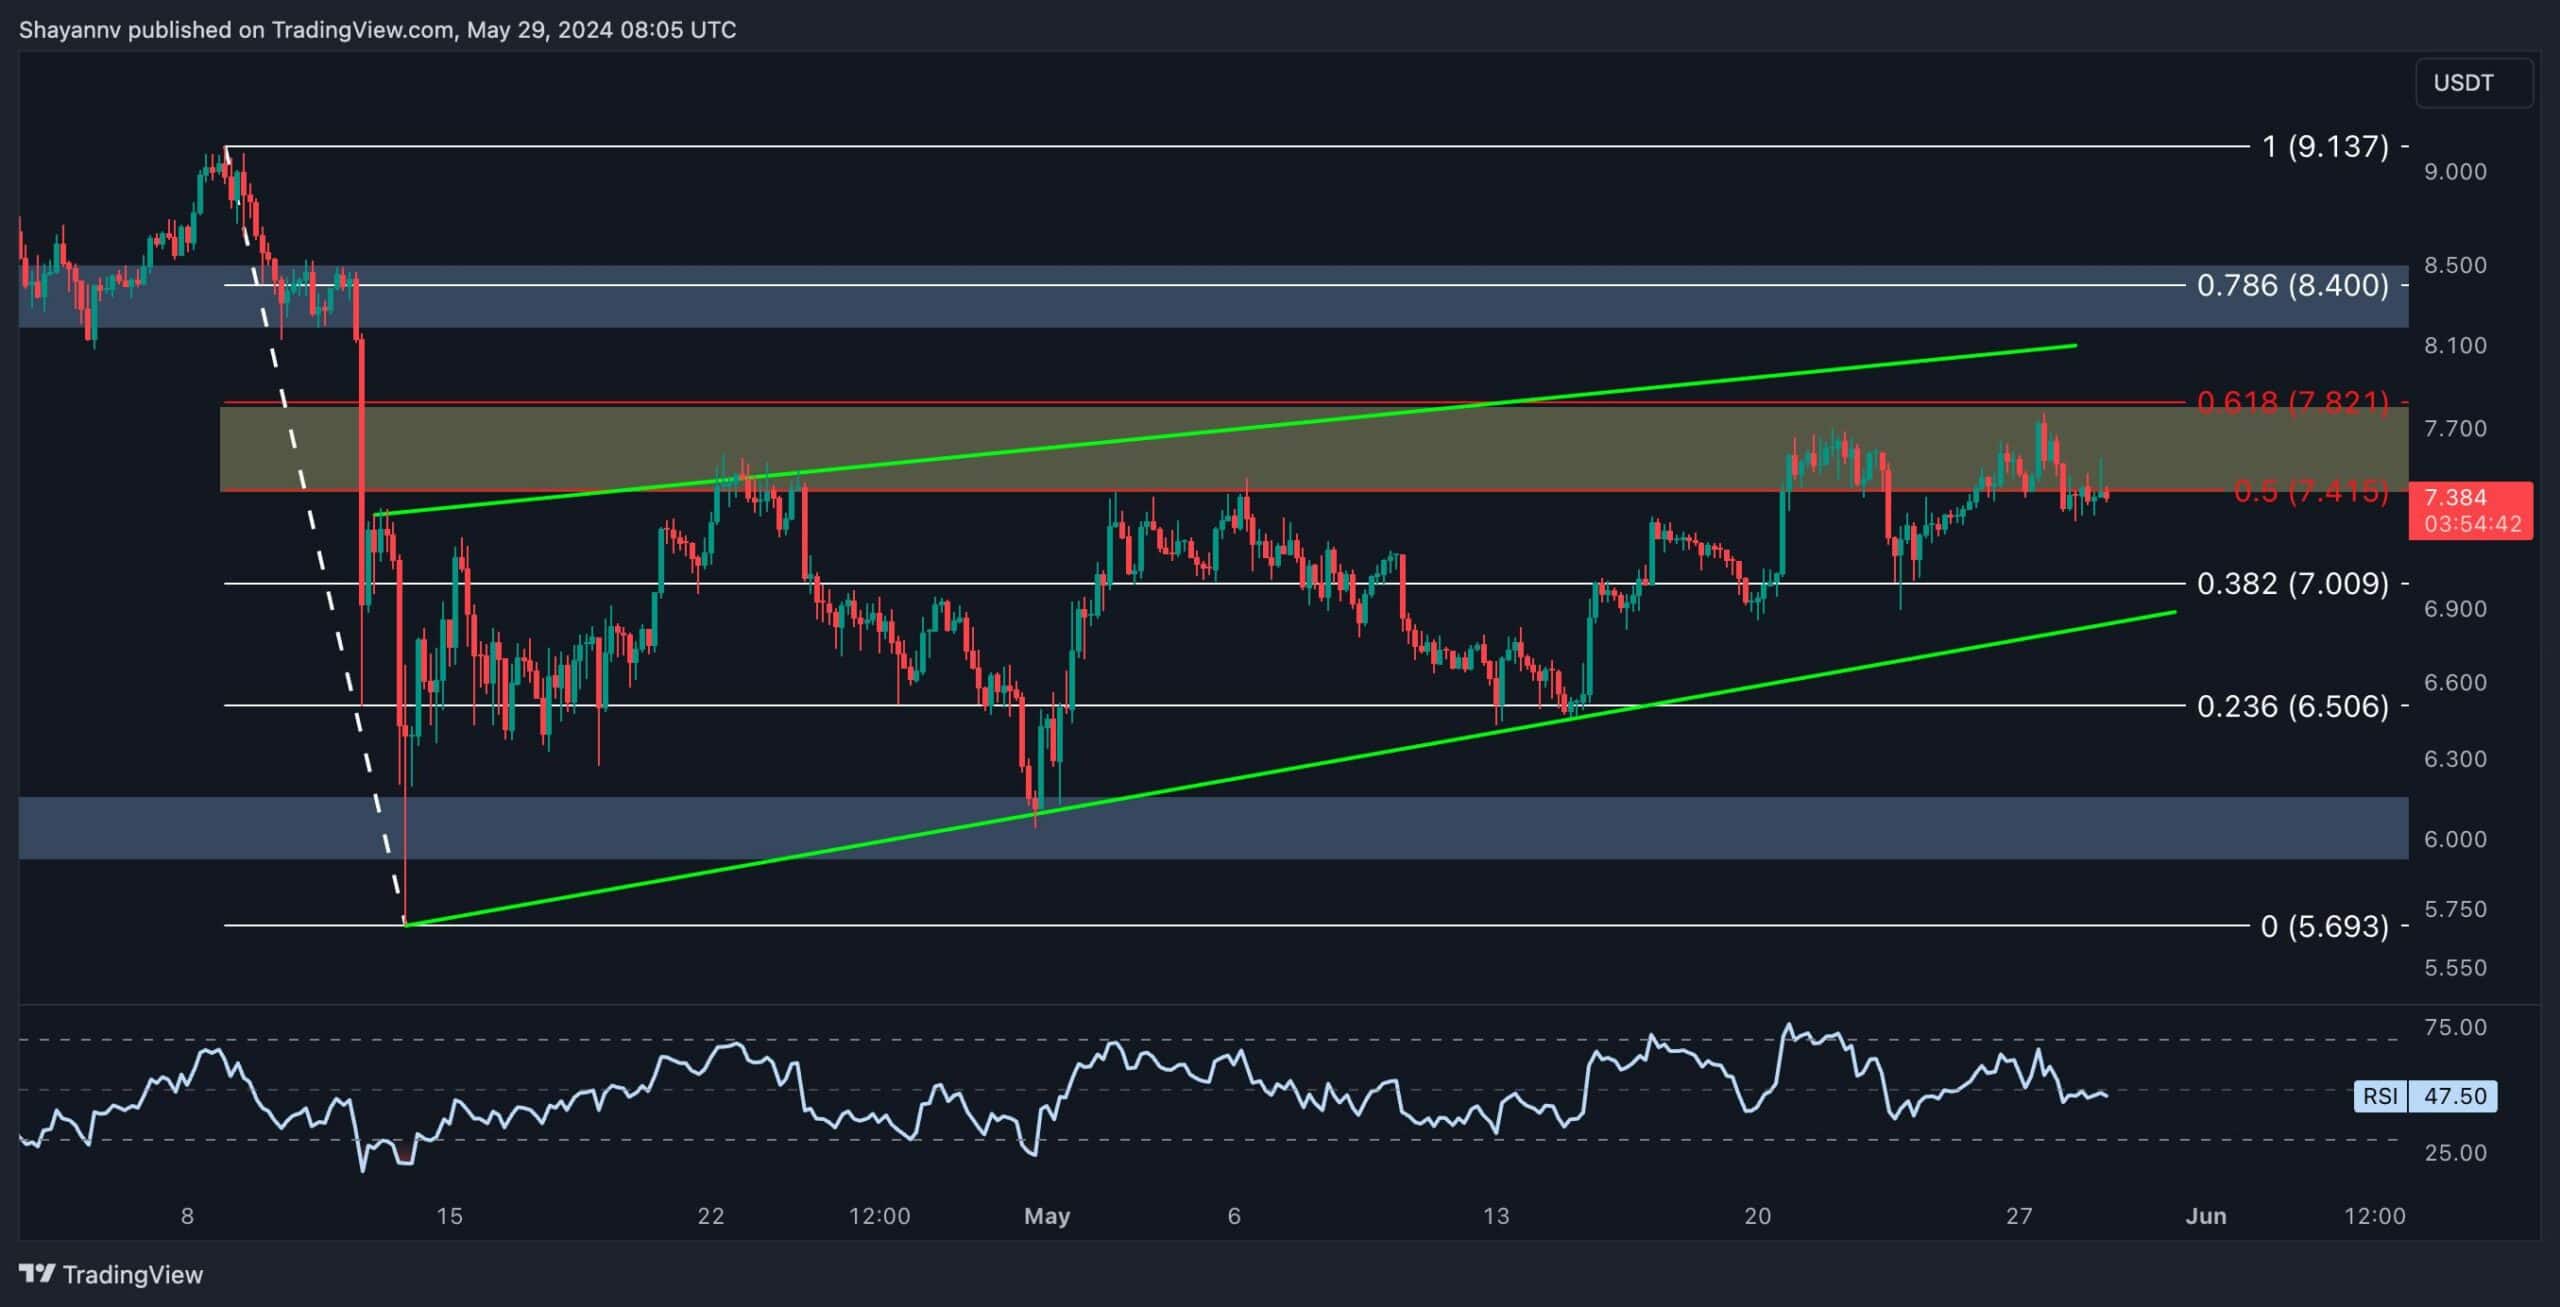
Sentiment Analysis
By Shayan
When the market is in a state of uncertainty and lacks clear direction, analyzing the sentiment in the perpetual market can provide insights into Polkadot’s potential future trajectory. This chart illustrates the Long/Short Accounts Ratio alongside DOT’s price.
In general, the total value of long and short positions in the market is balanced. When this value is equal, but the number of holders differs, it indicates that the side with more holders has a smaller average position value, mainly composed of retail investors, while the other side is dominated by institutional investors and large traders.
The Long/Short Accounts Ratio has been decreasing recently, reaching a value of 3. This means that the number of individuals holding long positions is three times higher than those with short positions, while the total position value remains equal on both sides. This suggests that the long side is primarily made up of retail traders with smaller average position sizes, whereas the short side likely comprises institutional investors with larger average positions.
On the other hand, the decline in the metric indicates a slight increase in the average position size of institutional investors on the short side. If this trend continues, it could signal growing institutional interest, potentially leading to heightened selling pressure for Polkadot.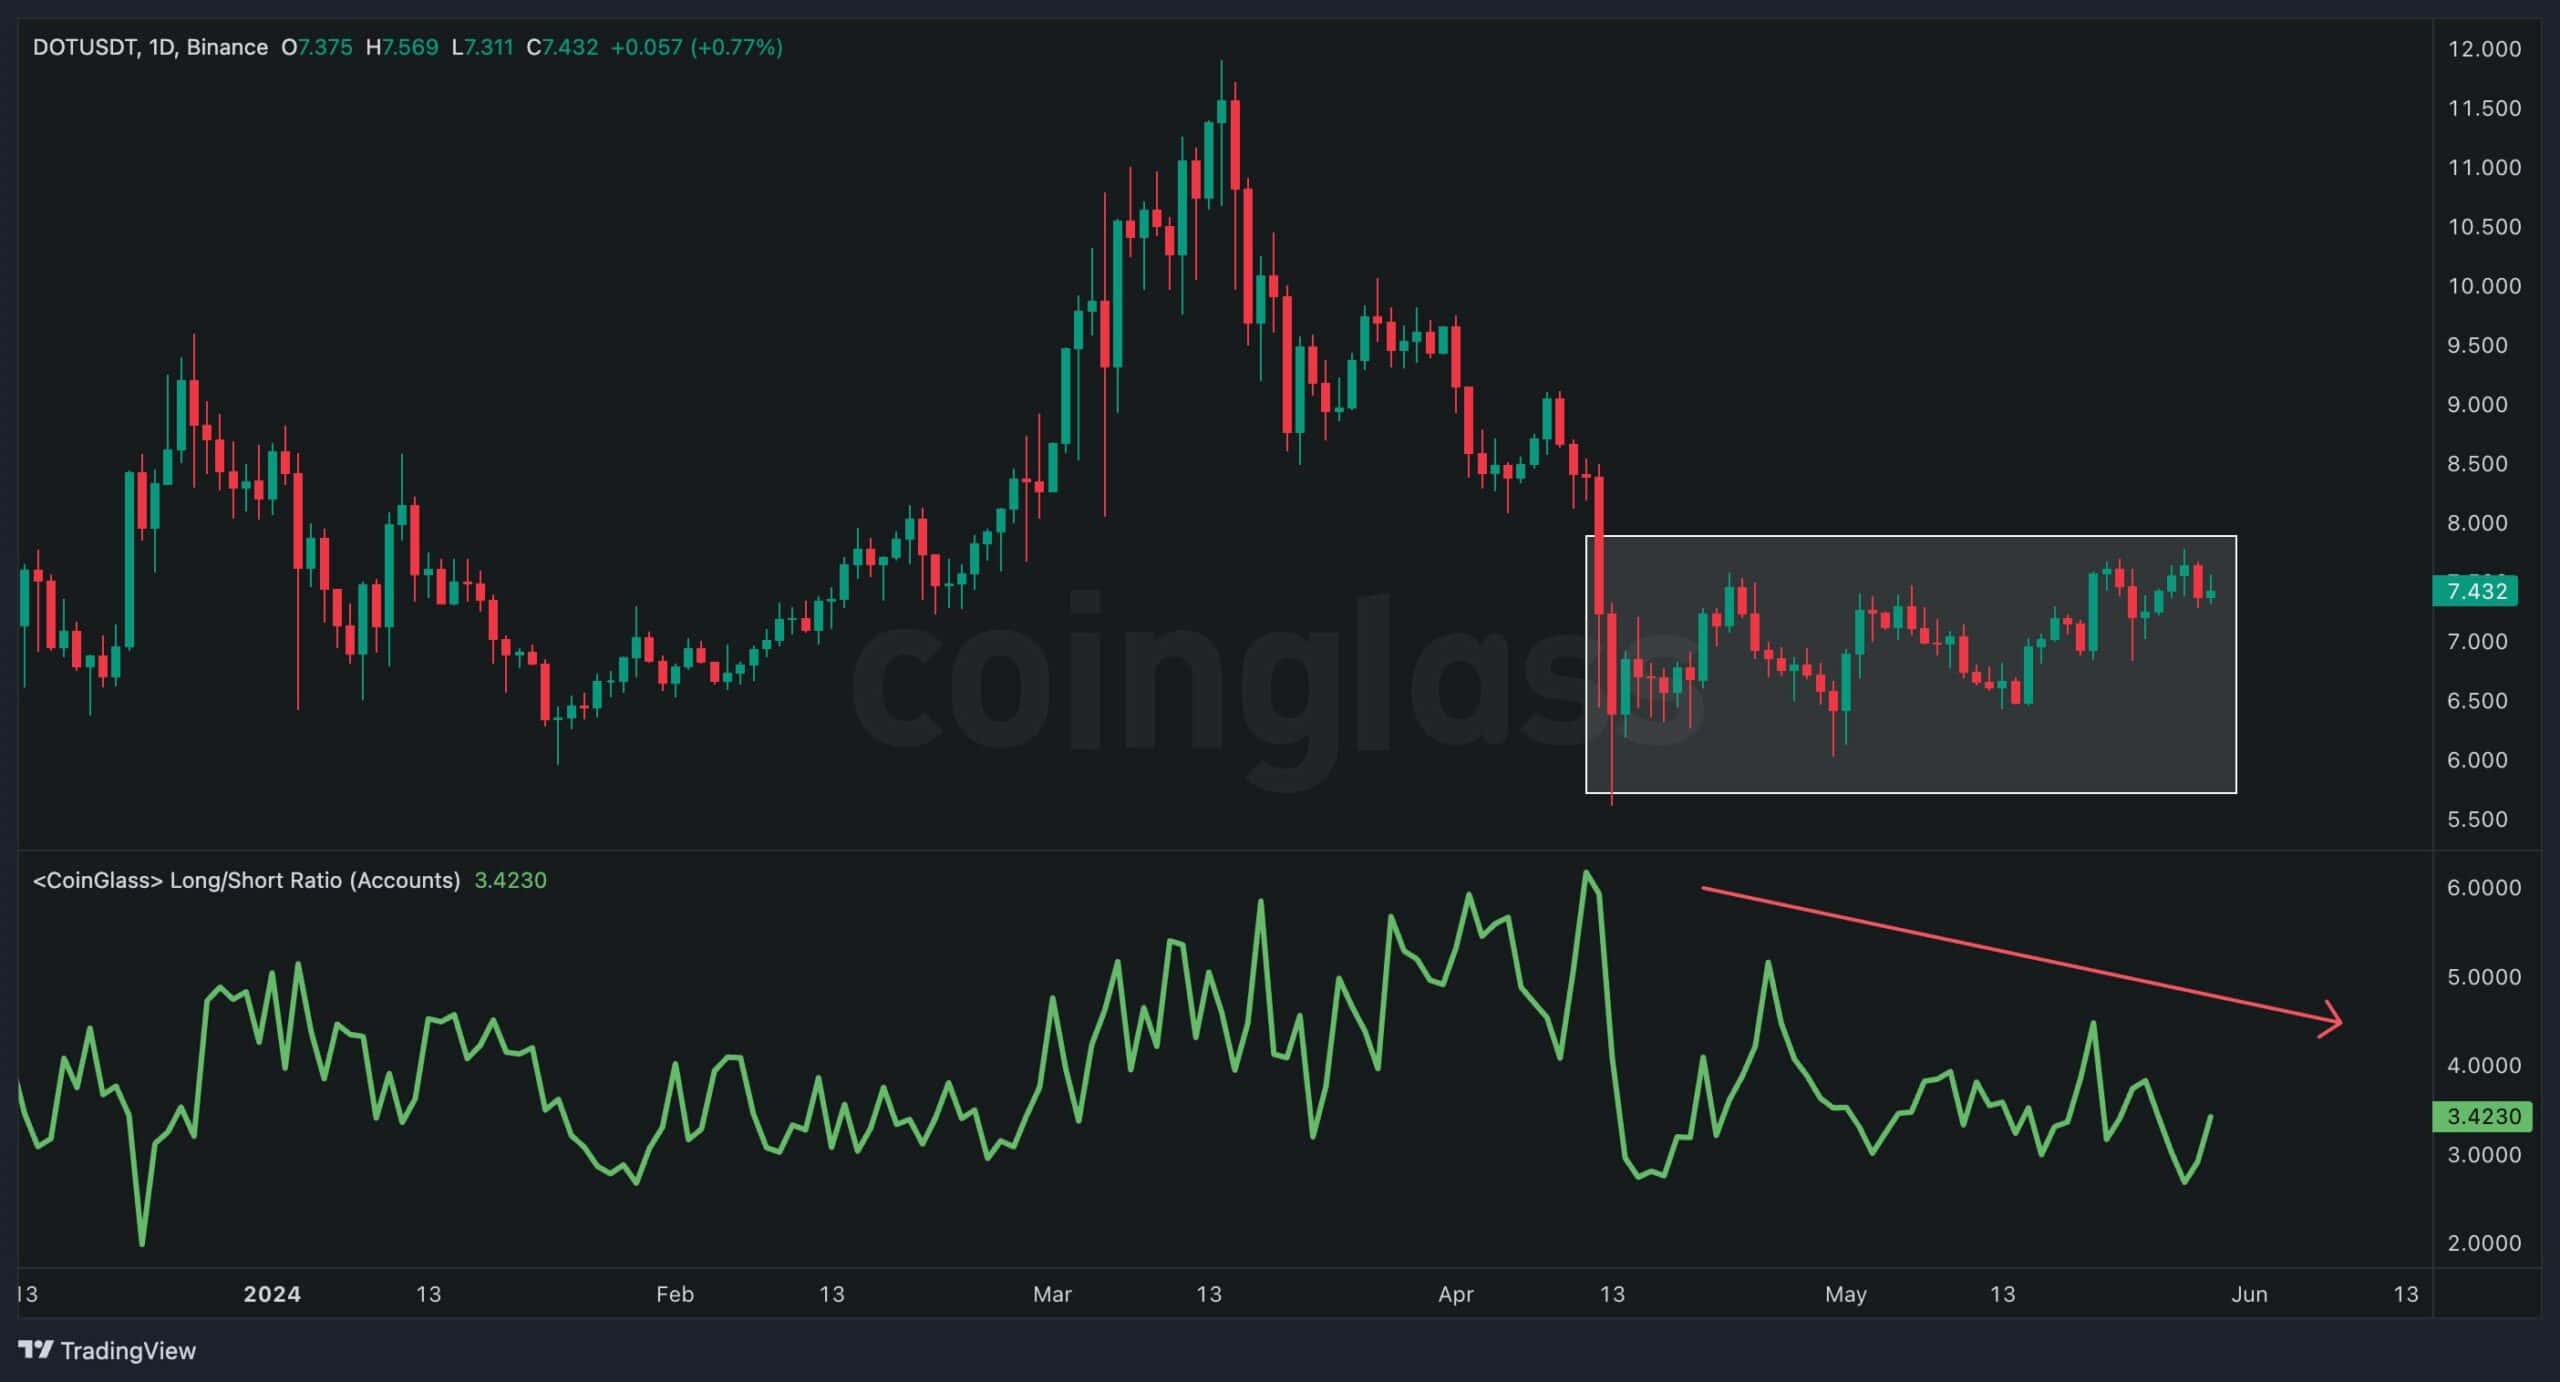
The post Bears Seem in Control, Is DOT About to Drop Toward $6.5? (Polkadot Price Analysis) appeared first on CryptoPotato.