Bearish: Positive Bitcoin Mentions Approach New 2020 Low As Fear Index Surges
Recent data revealed that the number of positive Bitcoin mentions on the popular social media platform Twitter has dropped significantly since the halving in May.
At the same time, the fear and greed index has downgraded from its neutral stance in May to a more fearful state in June.
Twitter BTC Positivity Drops
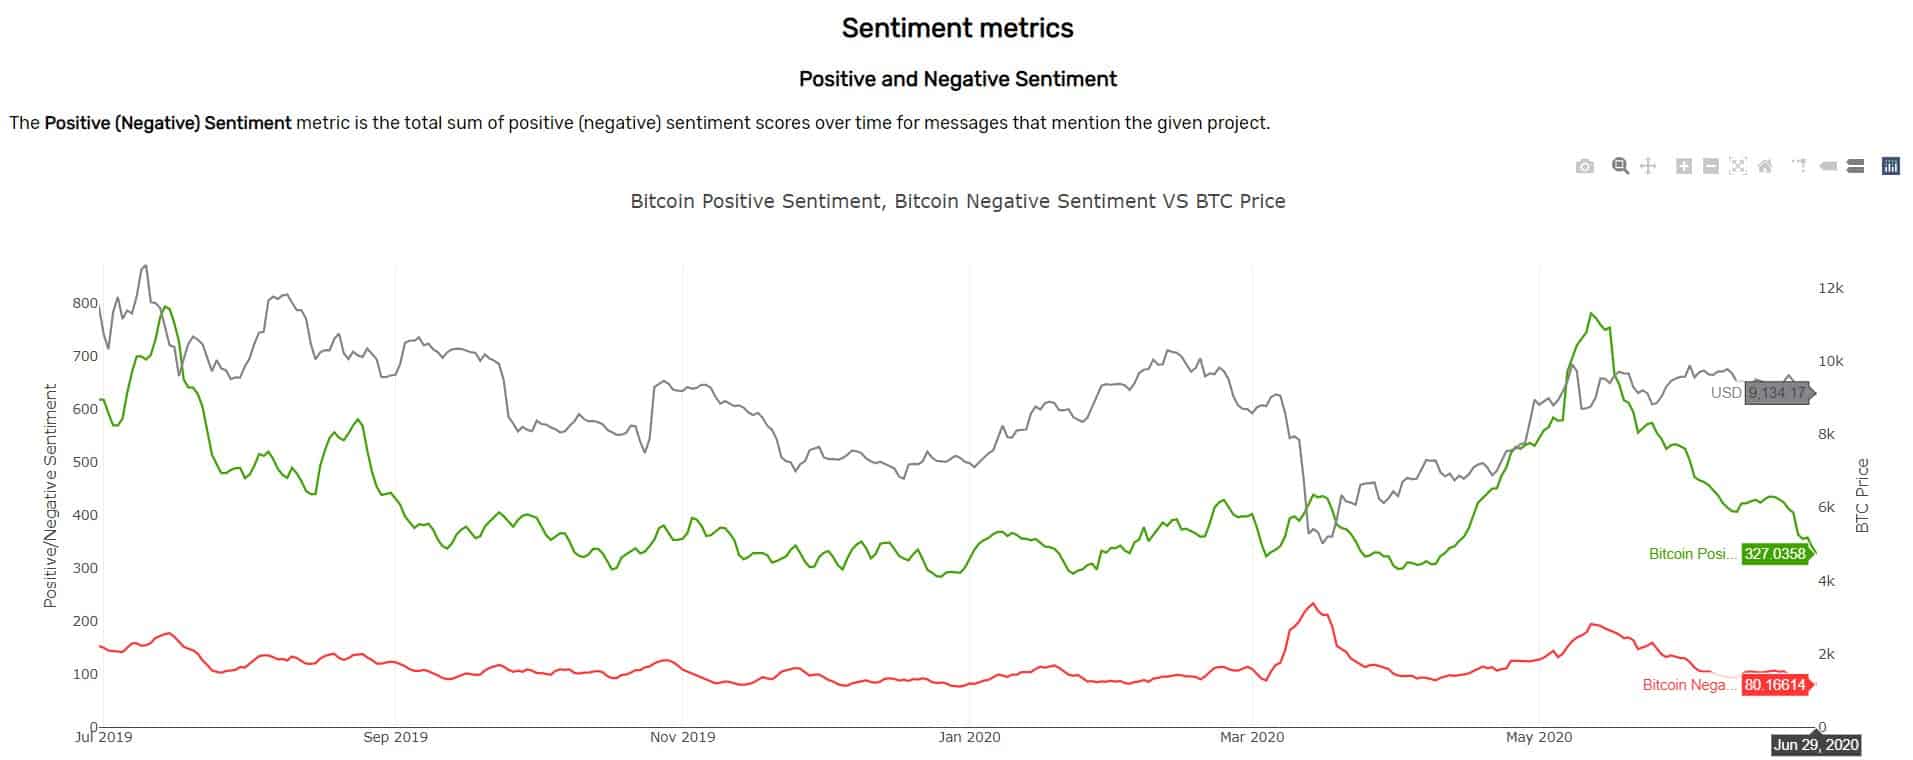
According to the data from the monitoring company Santiment, the number of positive Bitcoin mentions on Twitter reached its yearly high on May 12th – a day after the third halving. At that point, the amount equaled 781.5.

Since then, however, this metric has been on a rather sharp decline and is now “creeping close to a year-low positive score at 327.”
Typically, sudden movements in negative and positive mentions correspond with similarly volatile price developments. Such was the case in July last year after BTC reached its 2019 peak at nearly $14,000. As the price started to crumble shortly after, the number of positive mentions followed as well.
Another example can be extracted from the mid-March 2020 panic sell-offs. When the primary cryptocurrency plunged by 50% to below $4,000, the negative mentions skyrocketed to a yearly high of over 200.
Aside from the positive mentions declining now, the negatives are also relatively low. This supports a previous narrative from Google Trends, indicating that the total interest in the largest digital asset by market cap has decreased rather substantially after the halving.
Why So Fearful?
The Fear and Greed index follows the general sentiments in a particular financial market and provides a score ranging from 0 to 100. It measures and aggregates various types of data, such as social media presence, volume, surveys, and volatility.
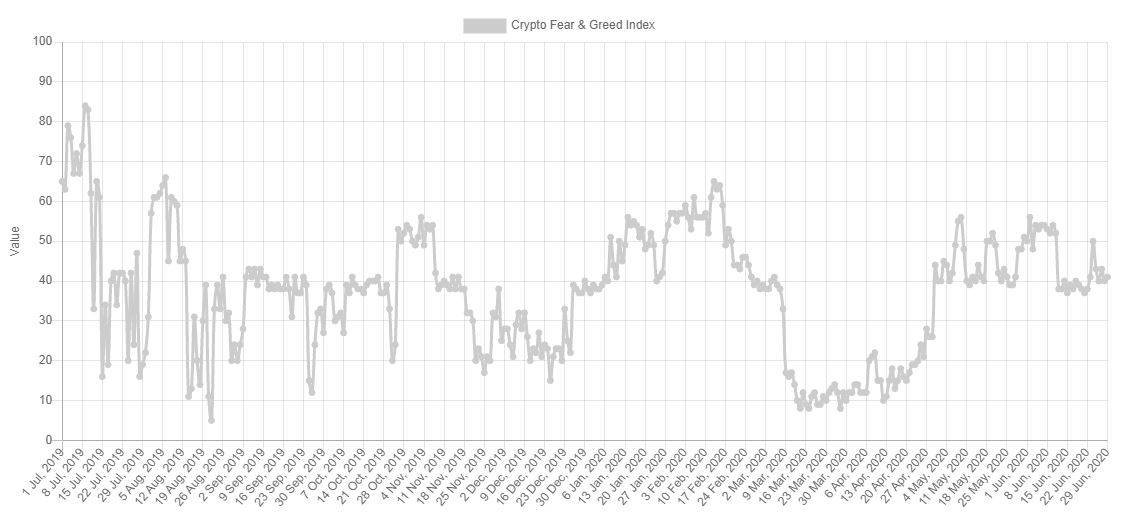
During the same yearly timeframe as the data above, the F&G Index for Bitcoin has performed somewhat similarly. For instance, it was in “greed” territory in early July when the price was over $12,000. What followed was weeks of fear as the asset was losing value.

The most fearful state came rather unsurprisingly in March this year. As the market was tumbling, the index was mostly in “extreme fear” for several consecutive weeks. It finally managed to break out two months later when the community was preparing for the halving.
It has been fluctuating in a tight range since then, but at the time of this writing is showing fear at 41.
Nevertheless, these trends and sentiments should not be perceived as a reliable price indicator. Bitcoin typically tends to head in the opposite direction.
During the most pessimistic state in March, 70% of participants in a poll noted that BTC will continue its downfall and will bottom below $3,700. However, instead of plunging beneath that point again, the primary cryptocurrency recovered fully and is currently trading at $9,100.
The post Bearish: Positive Bitcoin Mentions Approach New 2020 Low As Fear Index Surges appeared first on CryptoPotato.


