As Bitcoin Rips and Altcoins Crash: Historically, What Are The Chances for Alt-Season?
Bitcoin has been surging in the past few weeks to consecutive yearly highs. Speculations emerged within the community if or when BTC will even surpass its 2017 ATH of nearly $20,000.
At the same time, though, most alternative coins seemed to be dragging behind their leader. Bitcoin’s dominance highlights this – a metric that surged by nearly 7% in less than a month.
As such, it would be compelling to follow how altcoins have performed in relation to Bitcoin before, during, and after a BTC bull run.
History Lesson #1: The Summer Of 2017
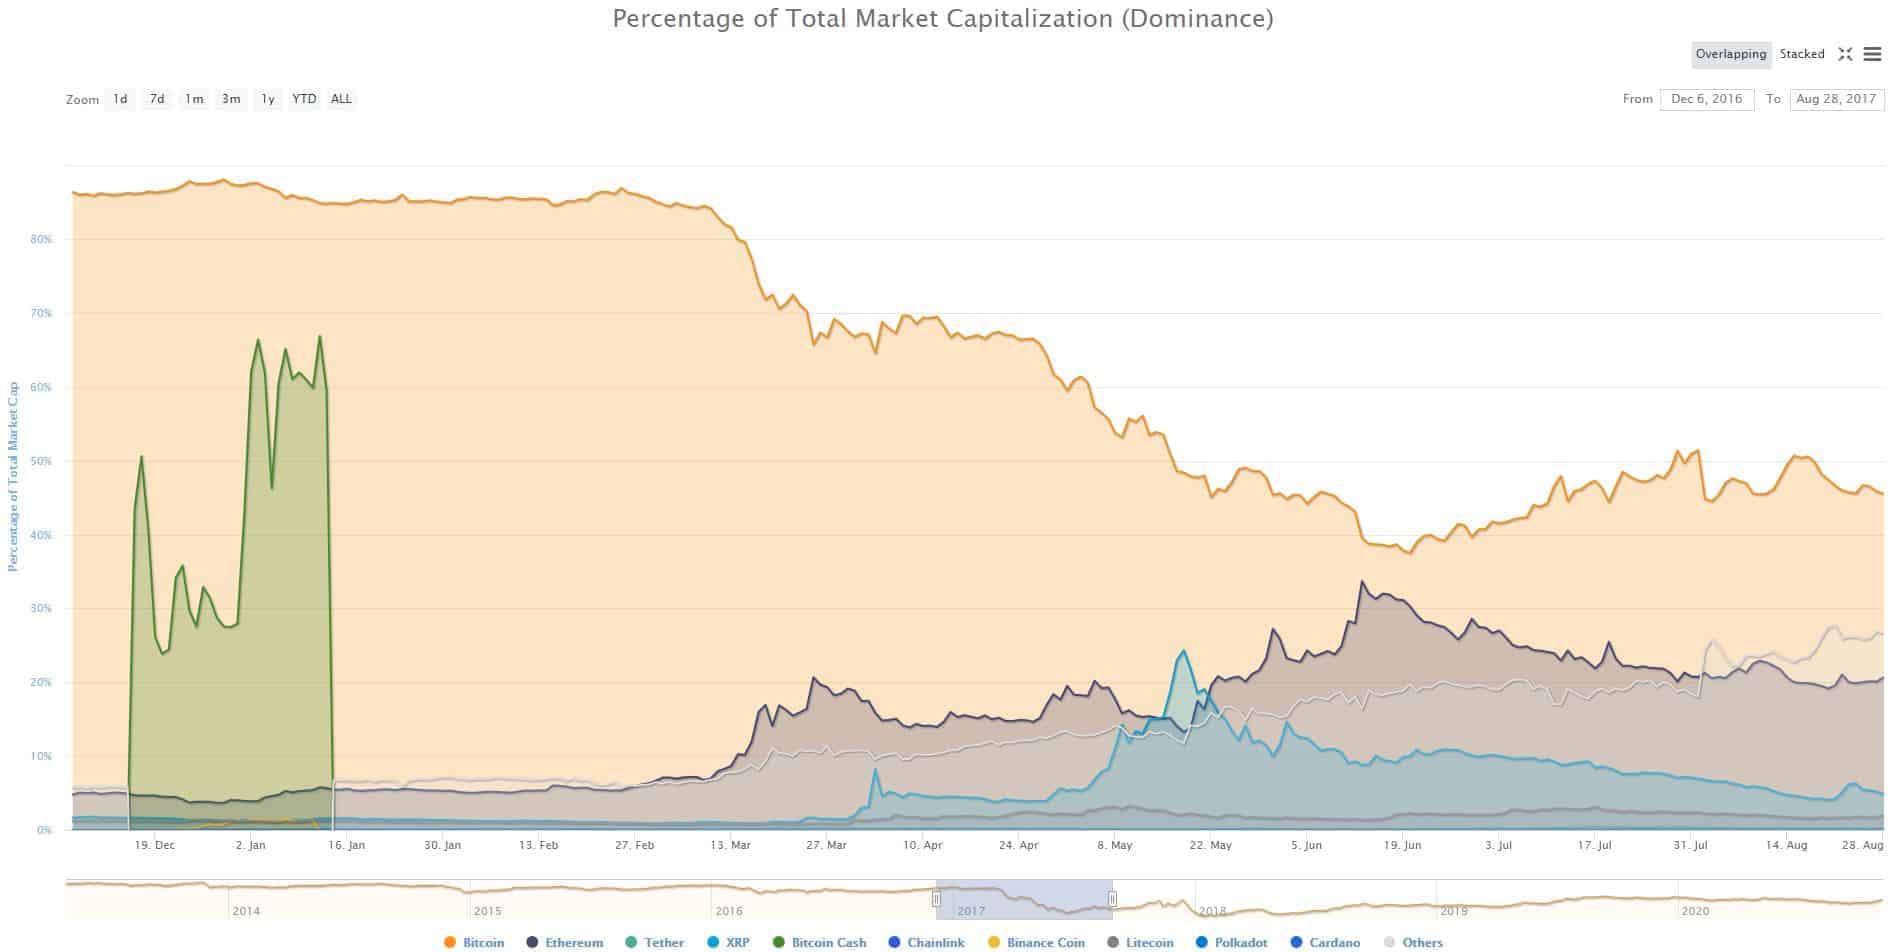
Bitcoin’s dominance is arguably the most accurate measuring tool when comparing the price performances of BTC and all other cryptocurrencies. The metric was above 75% for years until it finally broke below that level in mid-2017. This was the first prime example of an altseason in the “modern history” of the cryptocurrency industry.
Although Bitcoin wasn’t exactly plummeting in value as it traded above $2,000, most altcoins were skyrocketing and, consequently, reducing BTC’s dominance. Ethereum led the charge with a 5,000% YTD increase to June 2017. This resulted in the closest difference between the market capitalizations of BTC and ETH.
On June 19th, 2017, Bitcoin was responsible for 38% of the entire cryptocurrency market cap, while Ethereum took 31%. Other digital assets like Ripple and Litecoin also enjoyed bull runs at the time.

History Lesson #2: The Winter Of 2017/2018
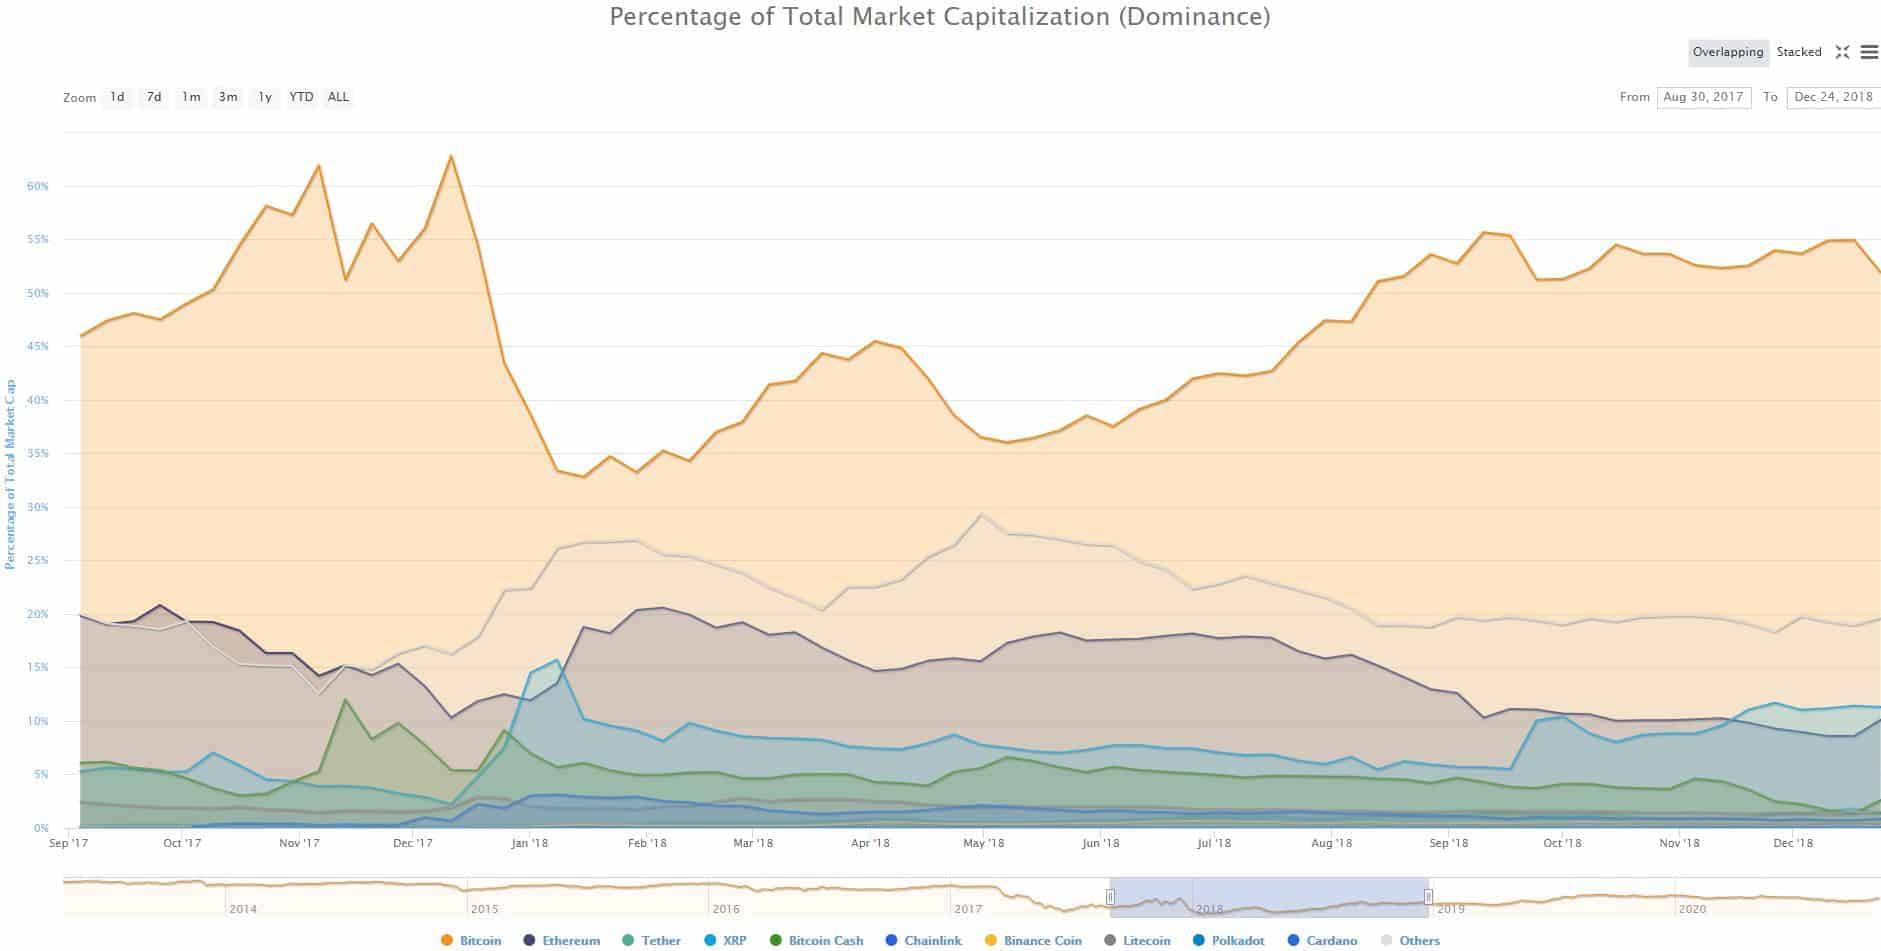
The roles reversed by the end of the year. Bitcoin went on its most impressive price surge, resulting in its all-time high of nearly $20,000 in late December 2017.
Ethereum and most altcoins were also spiking, but they couldn’t complete with the first-ever cryptocurrency. Bitcoin regained most of its dominance losses and returned above 60%.
However, the volatility continued, and the situation changed yet again in the upcoming weeks. As BTC was retracing from its highs, another brief altseason materialized.
By mid-January, Bitcoin was already down to $13,000, while Ethereum saw its ATH at $1,400 during the ICO craze. Other cryptocurrencies like Ripple and Cardano peaked in January as well.
The result took BTC’s dominance to below 33%. Ethereum had 20% of the market share, Ripple 8%, Bitcoin Cash 5%, while Cardano and Litecoin accounted for about 2.3% each.
The infamous bear market took over, and most prices plummeted by the end of 2018. However, BTC’s percentage decline was significantly less harmful than the alts’. As such, Bitcoin increased its dominance to about 55%.

Most Recent History Lessons: 2019/2020
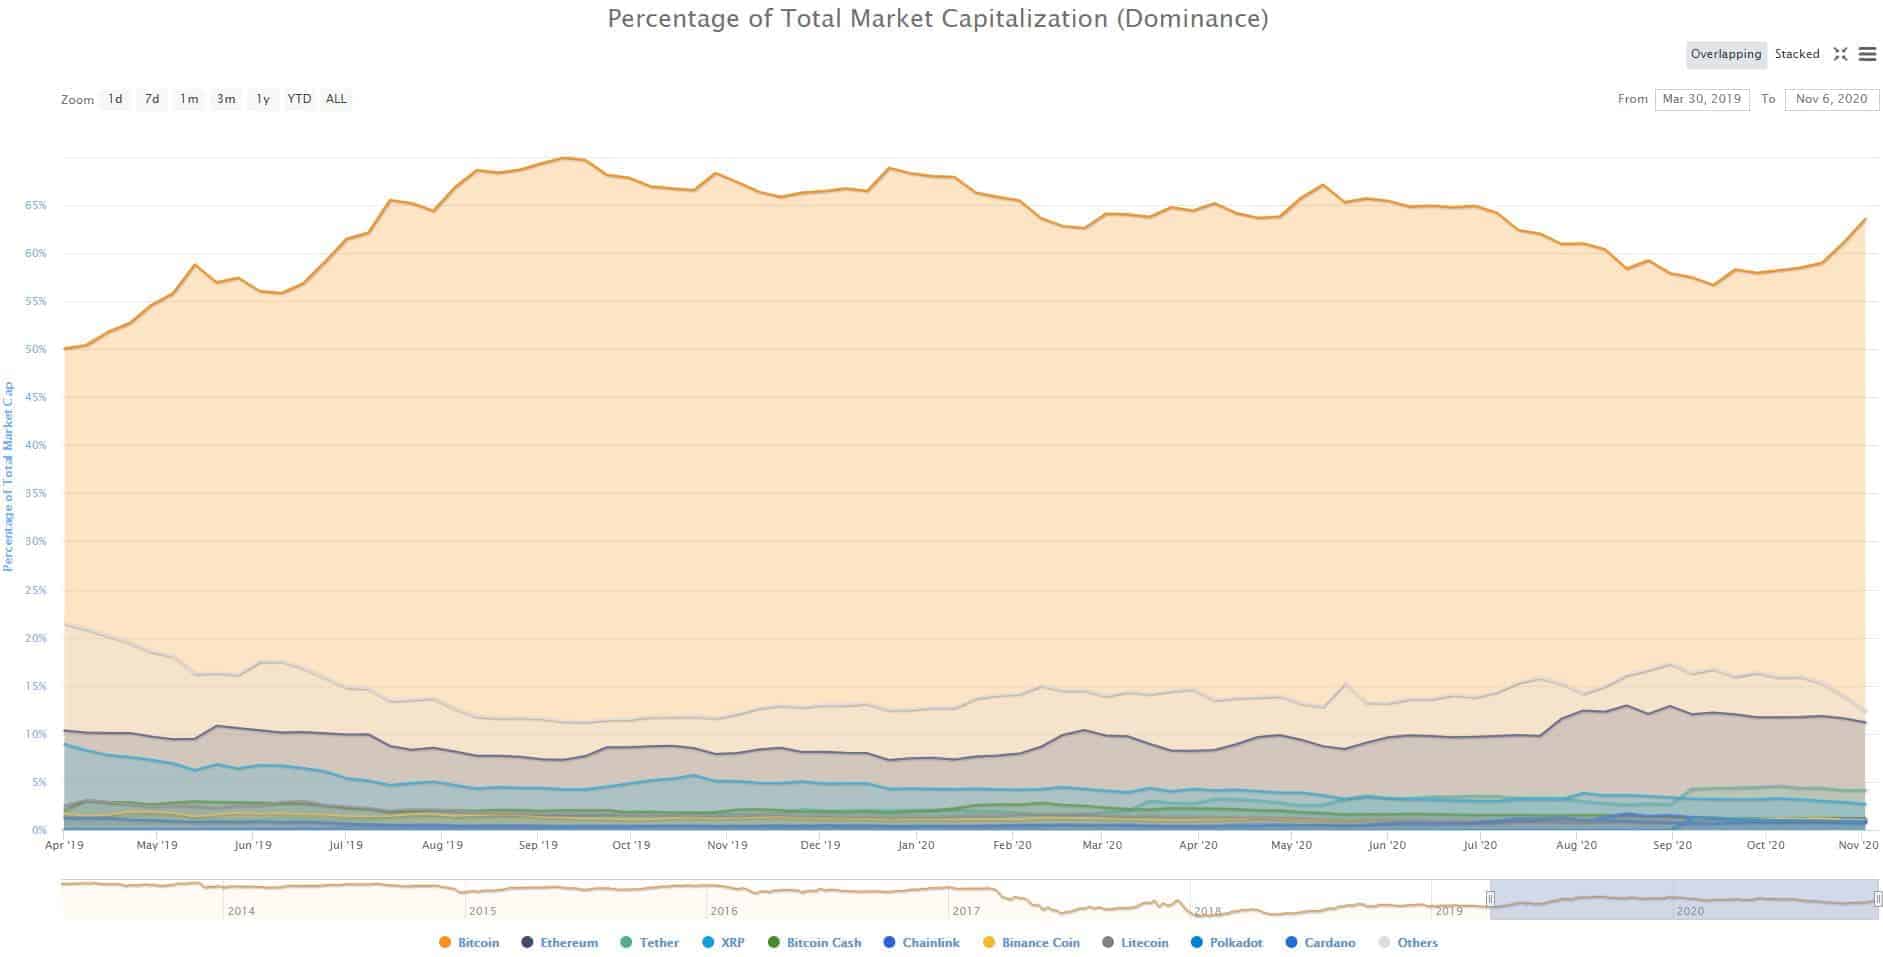
During the bull run in the summer of 2019, Bitcoin led the cryptocurrency market to yearly highs. The primary cryptocurrency reached $13,900 and grew its dominance above 60%.
The subsequent retracement hurt the altcoins the most again, and their market share kept declining. Bitcoin’s dominance surged to 70% in September 2019 – the highest level in over two years.
Then came the turbulent 2020. The COVID-19 outbreak rattled all financial markets, including the cryptocurrency field. No asset was exempt from extreme volatility, especially in the first half of the year.
When the dust began to settle, and the markets returned to previous levels, the crypto industry saw the birth of another craze – DeFi. Unfamiliar to this period terms like “yield farming” took the stage by storm. New decentralized finance projects and tokens started popping up daily.
They attracted significant attention, which ultimately boosted prices. On some occasions, even triple-digit daily pumps seemed normal.
Similarly to the ICO era, most decentralized finance protocols employed the Ethereum blockchain. Naturally, the ETH token followed the trend, broke its 2019 high, and jumped above $400.
Most altcoins followed suit and reduced BTC’s dominance from 67% in May to 56% in September. The word “altseason” was hovering around the cryptocurrency community.
While the altcoins were marching higher, Bitcoin remained relatively steady and traded around $10,000 for an extended period, especially in September. However, as BTC saw its dominance declining, the asset decided to act.
Whether the reason was massive companies purchasing bitcoins, increased institutional interest, or repeating trading cycles, the largest digital asset went on a roll. Precisely a month ago, on October 6th, BTC sat at $10,500.
In the following weeks, BTC gained over $5,000 of value resulting in a new record since January 2018 of about $16,000. The dominance went back to 65% as most altcoins were left far behind.

Conclusion
The data described above aims to shed some light on the cryptocurrency market cycles. It exemplifies how rapidly the situation can change within the industry.
Although the altcoins may not be booming as much as some expect, it doesn’t mean that the trend couldn’t reverse soon, and the “altseason” word starts spreading around again.


