Anticipated Retracement? Cardano Dips Below $2 Following Market Downturn (ADA Price Analysis)
ADA/USD – Market Retraces From Weekend Surge
Key Support Levels: $1.87, $1.77, $1.68.
Key Resistance Levels: $2.00, $2.10, $2.20.
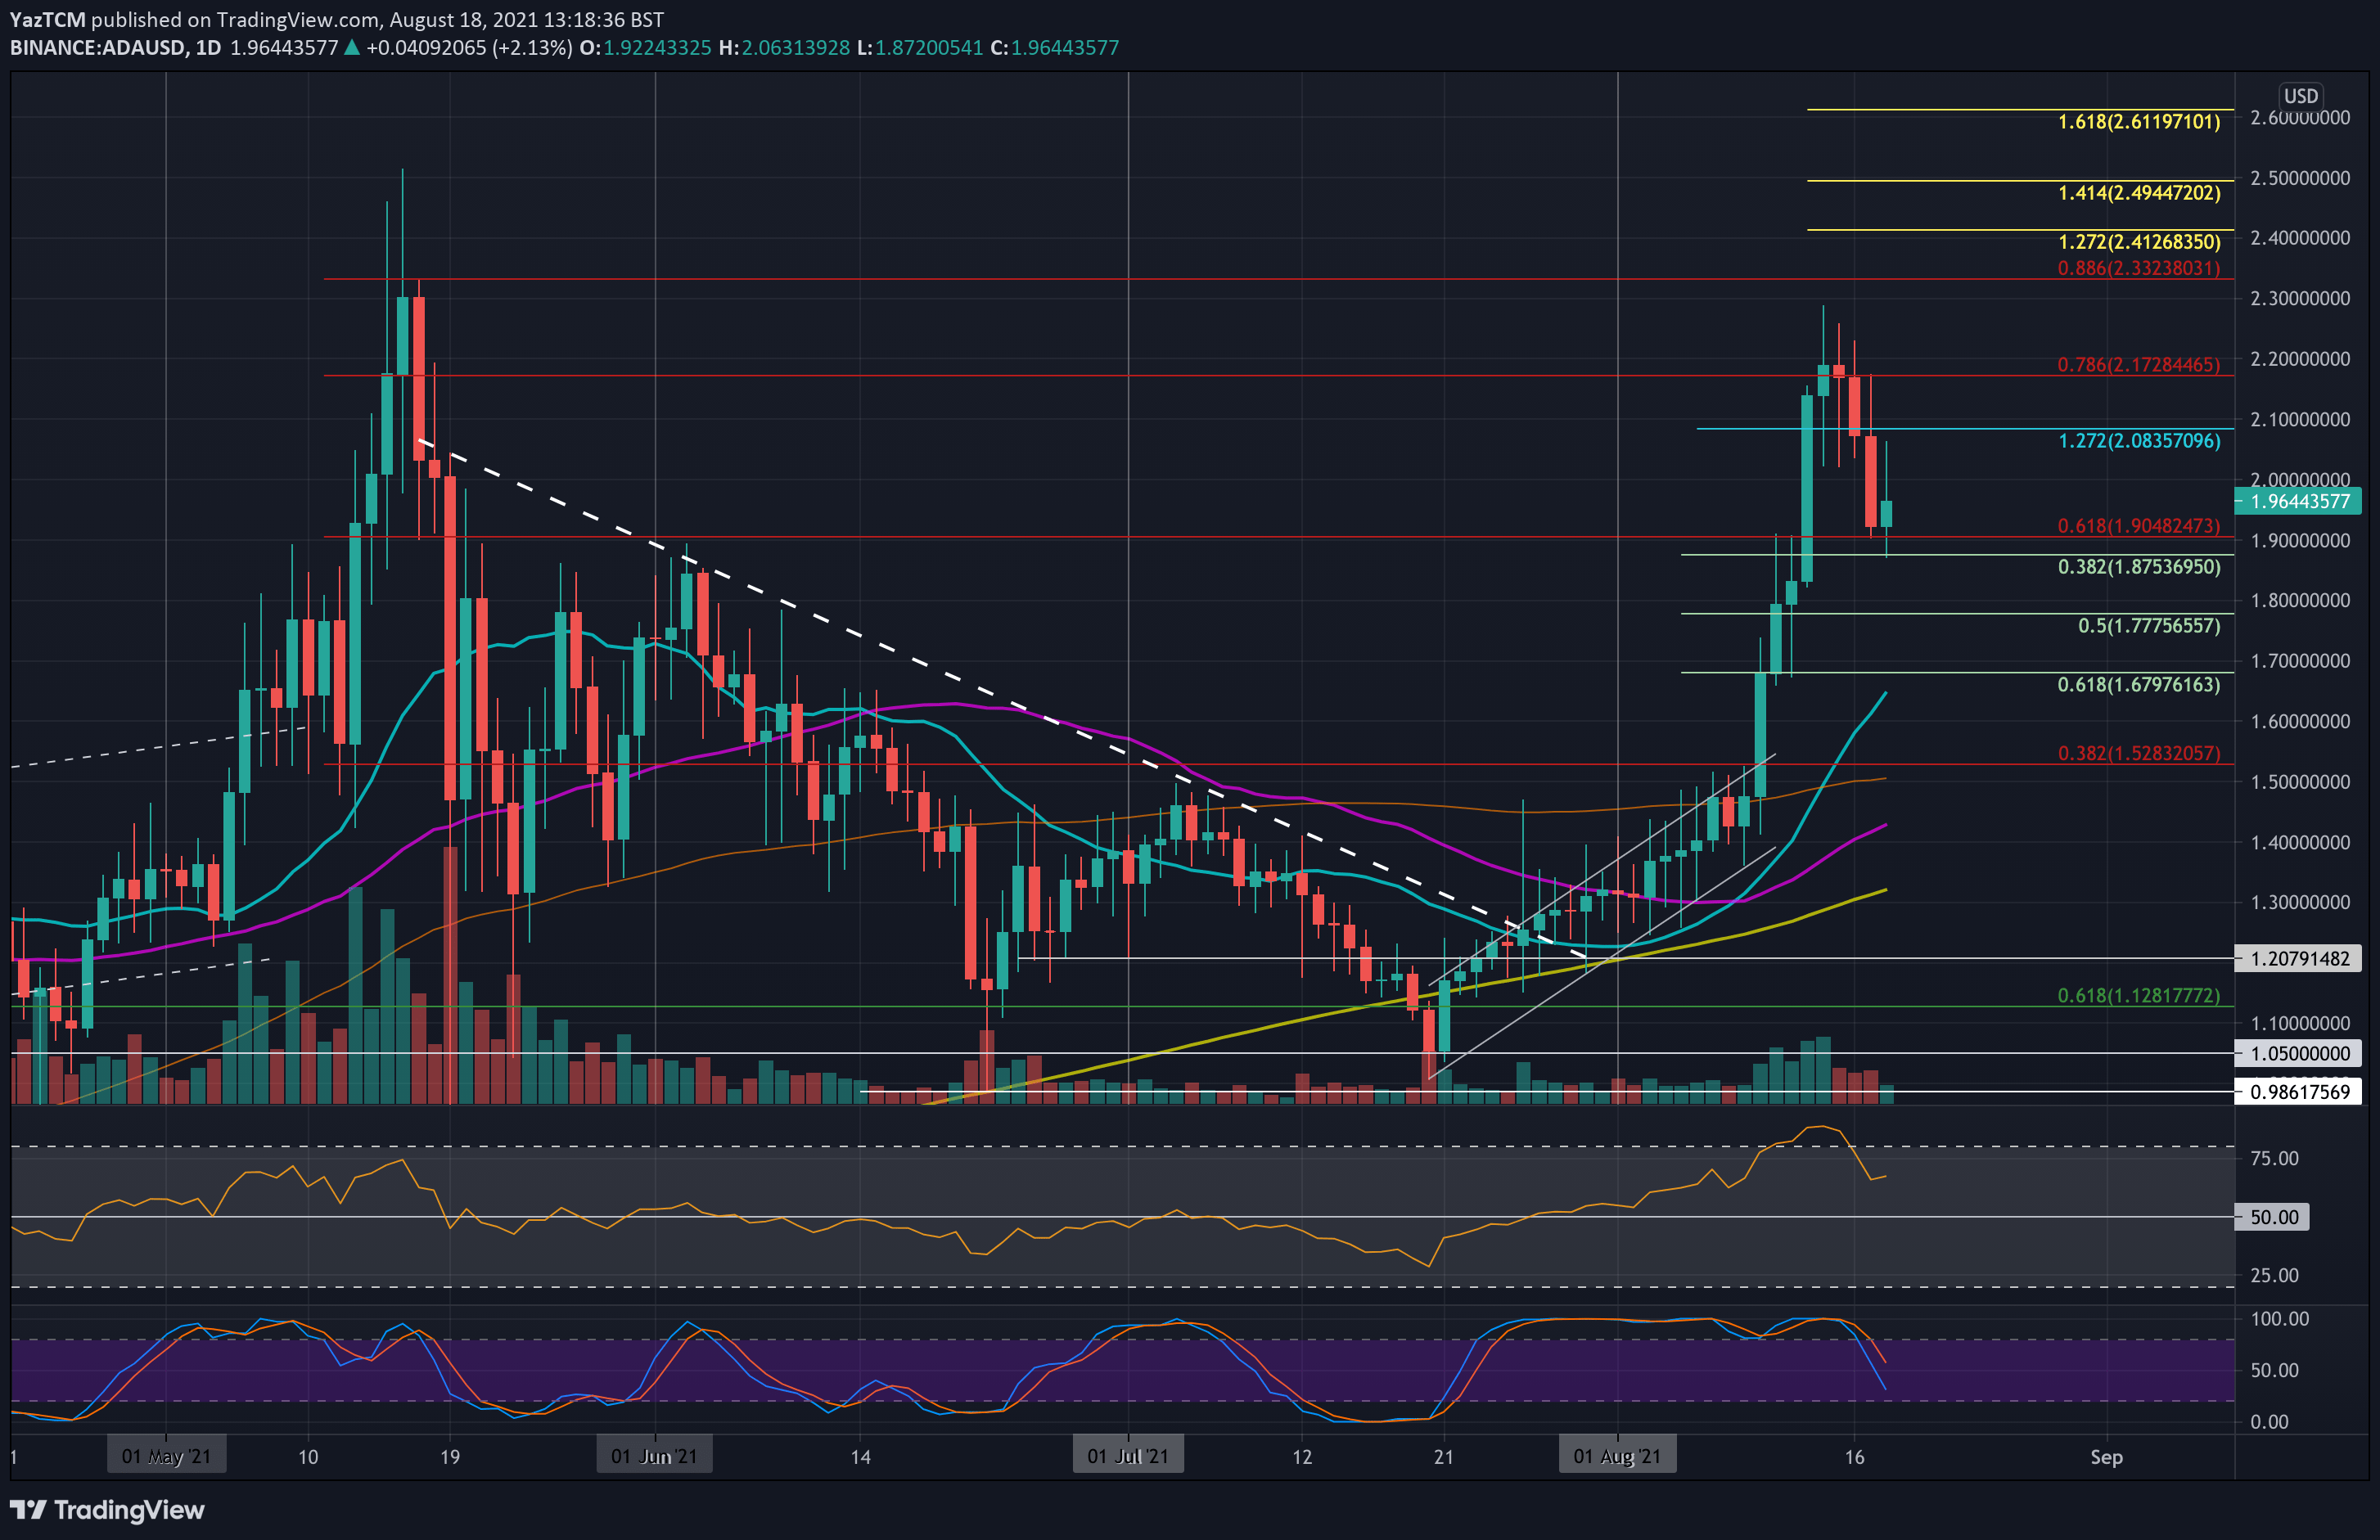
Despite dropping 6.5% today, ADA is still up 17% over the week. This is because it surged aggressively on Friday as it climbed from $1.85 to break $2.00 and hit $2.15. It continued on Saturday to reach as high as $2.28, where it finally rolled over.
On Monday, ADA dropped from $2.20 to hit $2.08, and it continued further yesterday as it fell beneath $2.00 to hit $1.90. Today, ADA spiked as low as $1.87, where it found support at a .382 Fib and has rebounded.
The market was extremely overbought prior to the rollover, and a retracement is always expected when the bulls become overextended like this.

ADA-USD Short Term Price Prediction
Looking ahead, the first resistance now lies at $2.00. This is followed by $2.10, $2.20 (bearish .786 Fib), $2.28, and $2.33 (bearish .886 Fib).
On the other side, the first strong support lies at $1.87 (.382 Fib). This is followed by $1.77 (.5 Fib), $1.68 (.618 Fib), and $1.50 (100-day MA).
As mentioned, the RSI was in extremely overbought conditions before this week’s retracement. The RSI has now returned to sustainable bullish levels as it sits beneath the overbought threshold. The bulls are still in charge and are primed to start another bull leg higher.
ADA/BTC – ADA Retraces Against BTC.
Key Support Levels: 4200 SAT, 4150 SAT, 4000 SAT.
Key Resistance Levels: 4570 SAT, 4765 SAT, 4900 SAT.
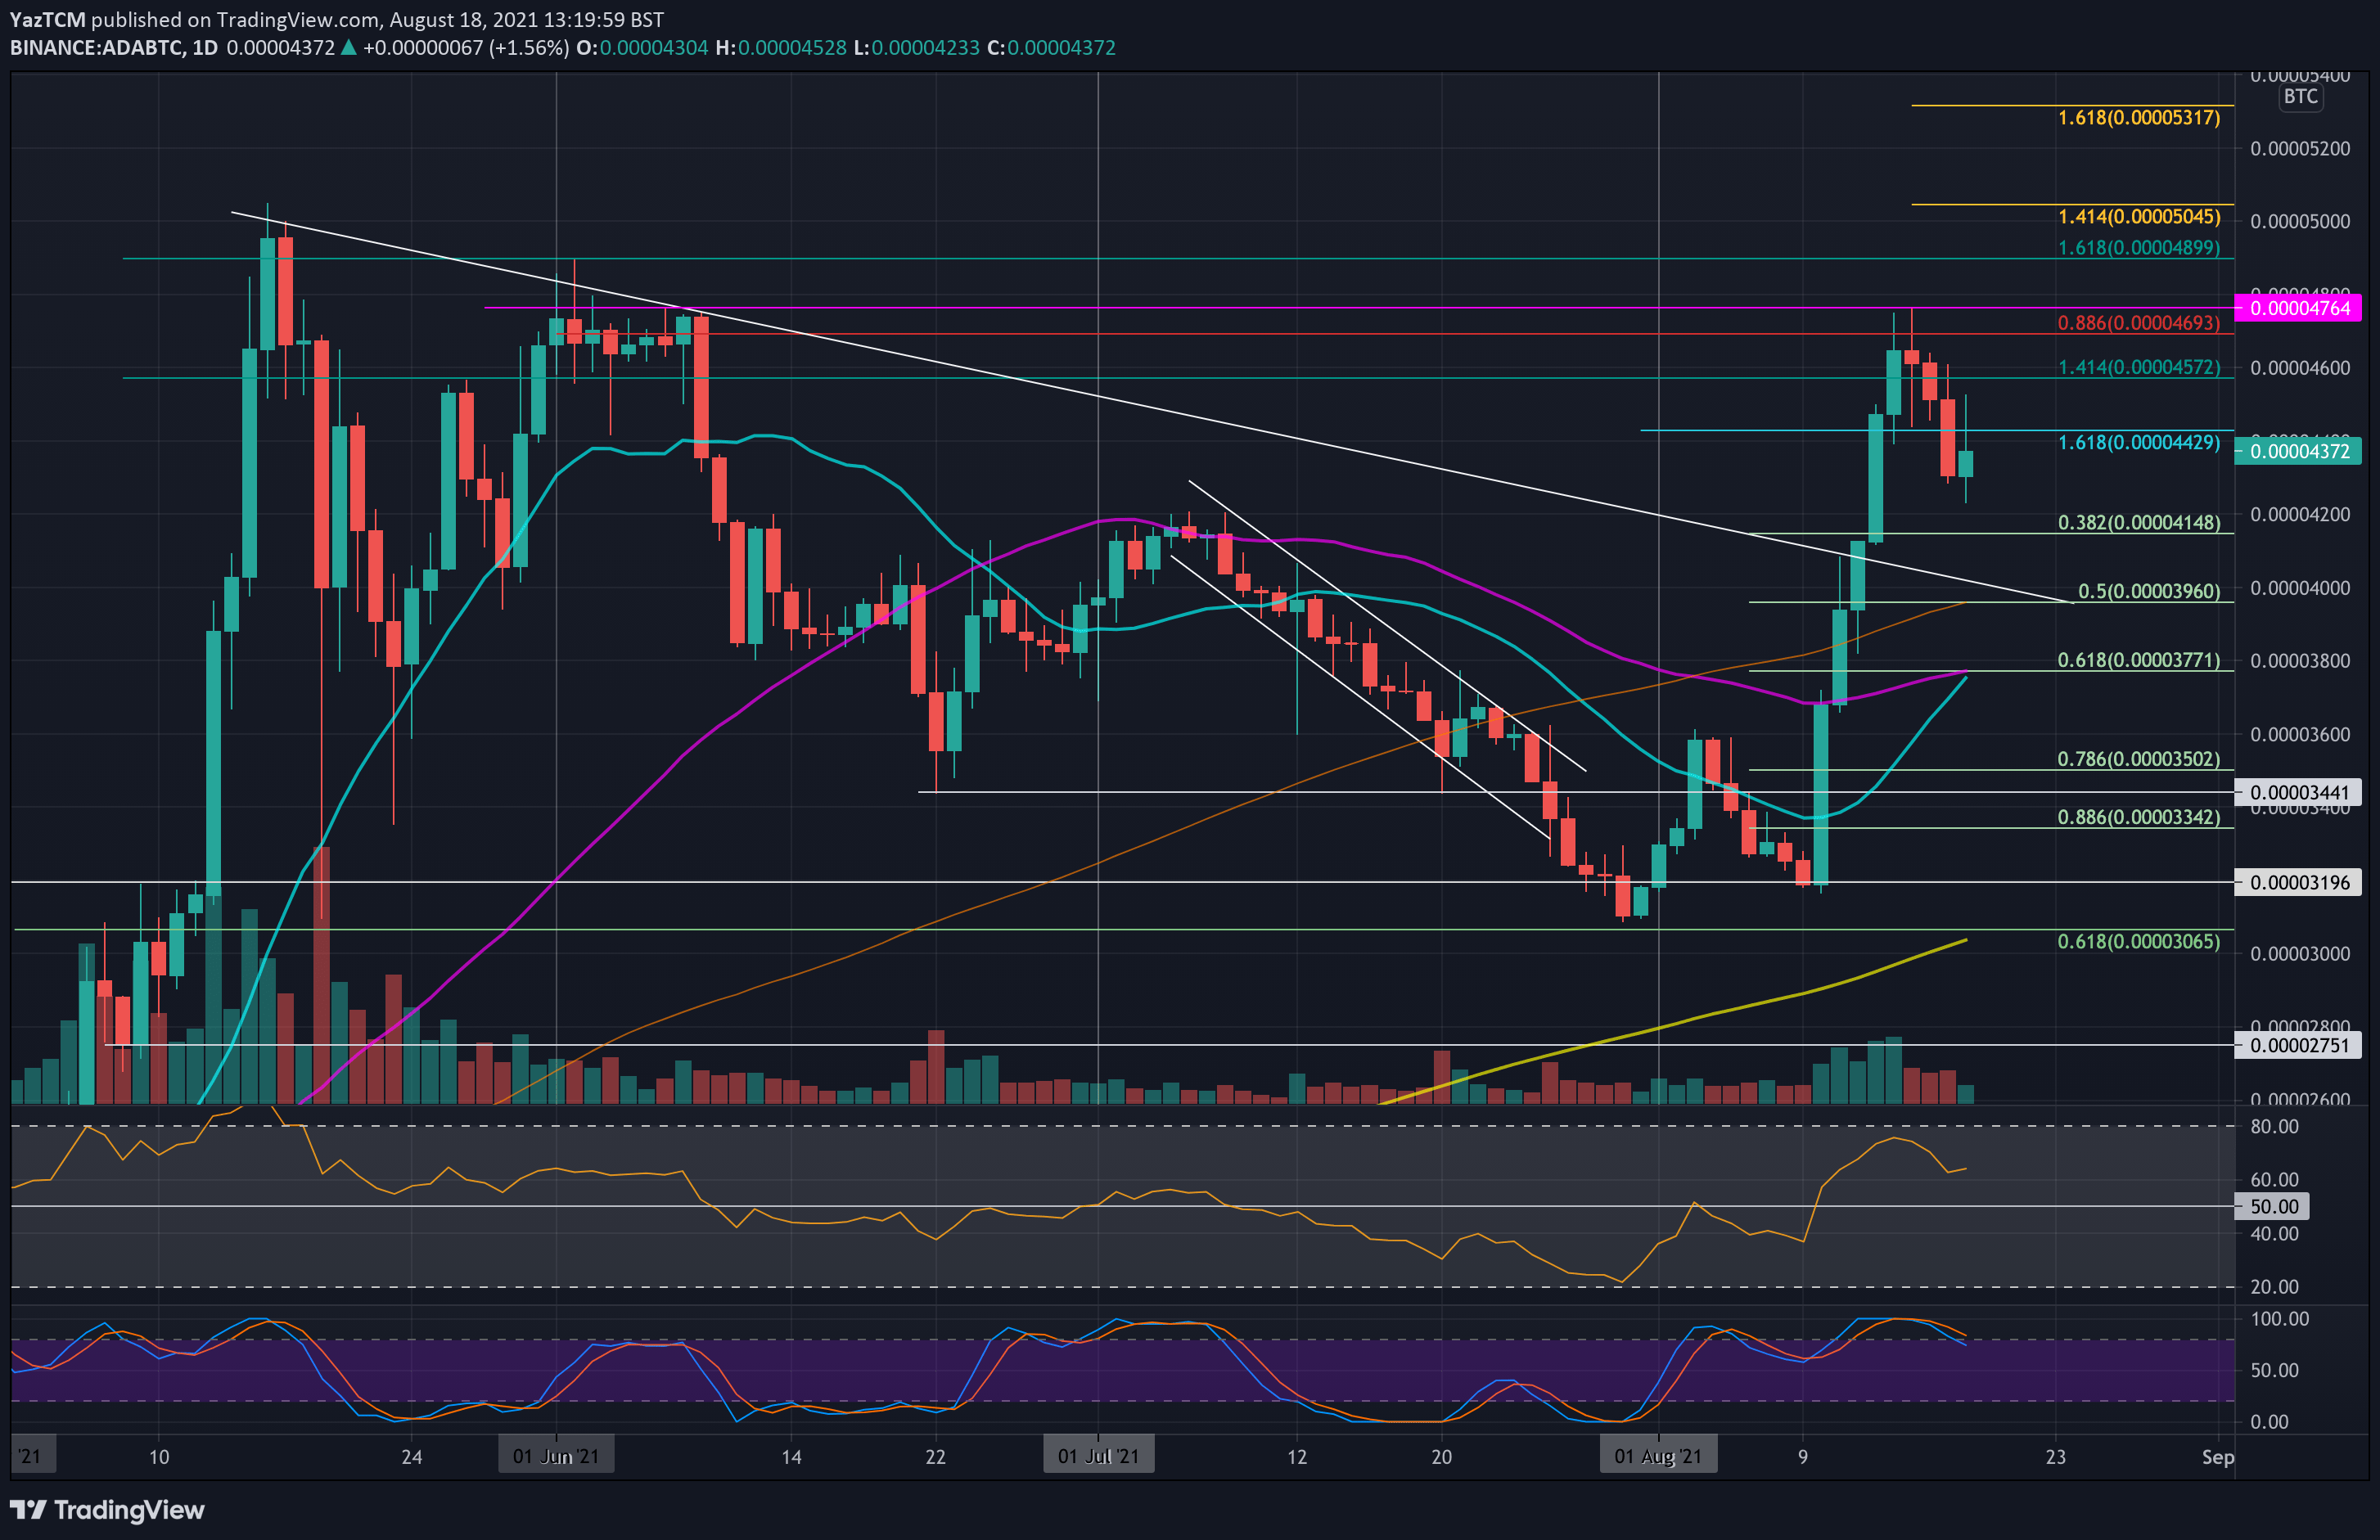
ADA reached as high as 4765 SAT (June resistance) over the weekend after surging from as low as 3200 SAT at the start of the previous week.
Since then, ADA rolled over and started to head lower. Yesterday, it fell from 4600 SAT to reach as low as 4290 SAT. It continued to spike as low as 4230 SAT today but has since rebounded to 4370 SAT.

ADA-BTC Short Term Price Prediction
Moving forward, the first resistance lies at 4570 SAT (1.414 Fib Extension). This is followed by 4765 SAT (June resistance), 4900 SAT, and 5000 SAT.
On the other side, the first support lies at 4200 SAT. This is followed by 4150 SAT (.382 Fib), 4000 SAT, and 3960 SAT(.5 Fib & 100-day MA).
The RSI is still in the bullish favor as the buyers remain in control of the market momentum.


