Analyzing Bitcoin Price Changes Based On Regional Working Hours
The latest bitcoin upwards price momentum seems to be coming from western buyers, but persistent Asian-hours selling pressure is tempering bullishness.
The below is from a recent edition of the Deep Dive, Bitcoin Magazine’s premium markets newsletter. To be among the first to receive these insights and other on-chain bitcoin market analysis straight to your inbox, subscribe now.
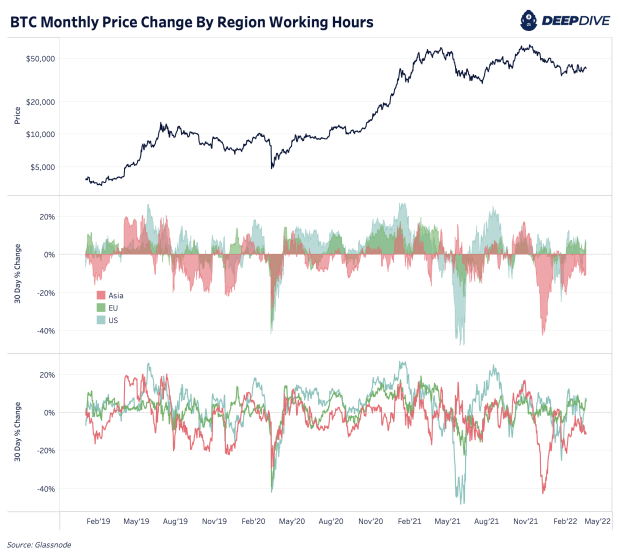
Thanks to Glassnode’s latest creativity and data engineering, we have a unique view of bitcoin’s price changes across major regional working hours. The charts below leverage their new data which tracks the cumulative 30-day price change during U.S., EU and Asian trading hours.
This provides us with an interesting view of the market’s buy- and sell-side pressure across geographic areas. The first chart below shows the absolute 30-day change in price since 2018. As price progresses higher, the recent price changes over the last year stand out more in the first chart. Below, we normalize this to a relative percent change for easier historical comparisons.
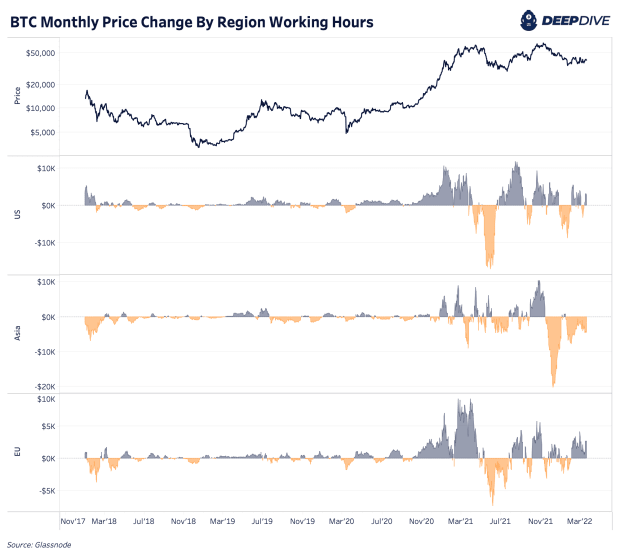
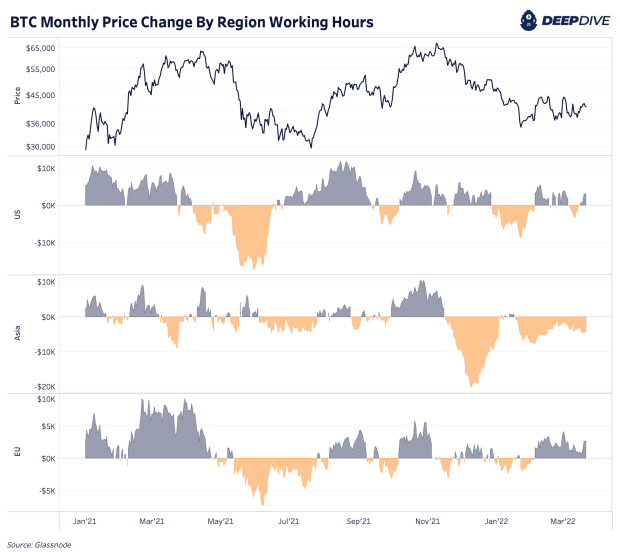
Over the last year, we can see that the July 2021 drawdown was heavily sold by the U.S. and moderately from the EU with relatively small sell-side changes from Asia. Yet in the current drawdown from previous all-time highs, Asia has dominated the sell-side pressure in the market and continues to do so in bitcoin’s current $35,000-to-$45,000 price range. The latest price momentum to the upside and hints of increased demand as of late look to be coming from U.S. and EU buyers.
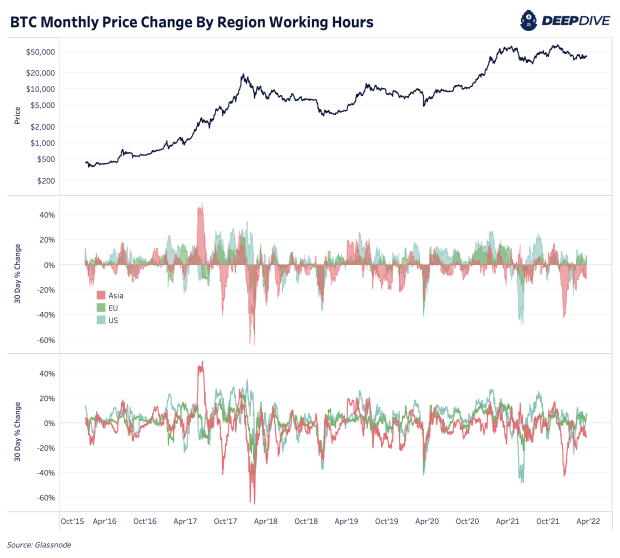
We find the data easier to compare on a relative percent basis in the below charts. The more recent Asia selling pressure (bitcoin price change during China Standard Time working hours) was some of the strongest sell pressure seen since the cycle top in December 2017.
The strongest sell pressure seen from the U.S. was from the two months prior to the July 2021 local bottom. Some of the largest U.S. buy-side pressure came right after this bottom with some immediate “buy the dip”-demand in August 2021. As we stand today, the 30-day percent change in bitcoin price is up 6.4% during EU trading hours, up 7.1% in the U.S. and down 11.1% in Asia.
With such a divergence in buy and sell pressure across regions and persistent Asian-hours selling pressure right now, it may be time for cautious optimism until we see bitcoin sustain a breakout above $45,000. From our view, we still look to be in a bear market rally period for risk-on assets. Approximately $46,000 still reflects the latest short-term holder on-chain cost basis.


