All Eyes on $0.40 as XRP Choppy Price Action Takes Hold (Ripple Price Analysis)
Ripple’s price has struggled to break the significant descending trendline at $0.42 and is consolidating. However, it now faces the critical support level of the 200-day moving average.
Technical Analysis
By Shayan
The Daily Chart
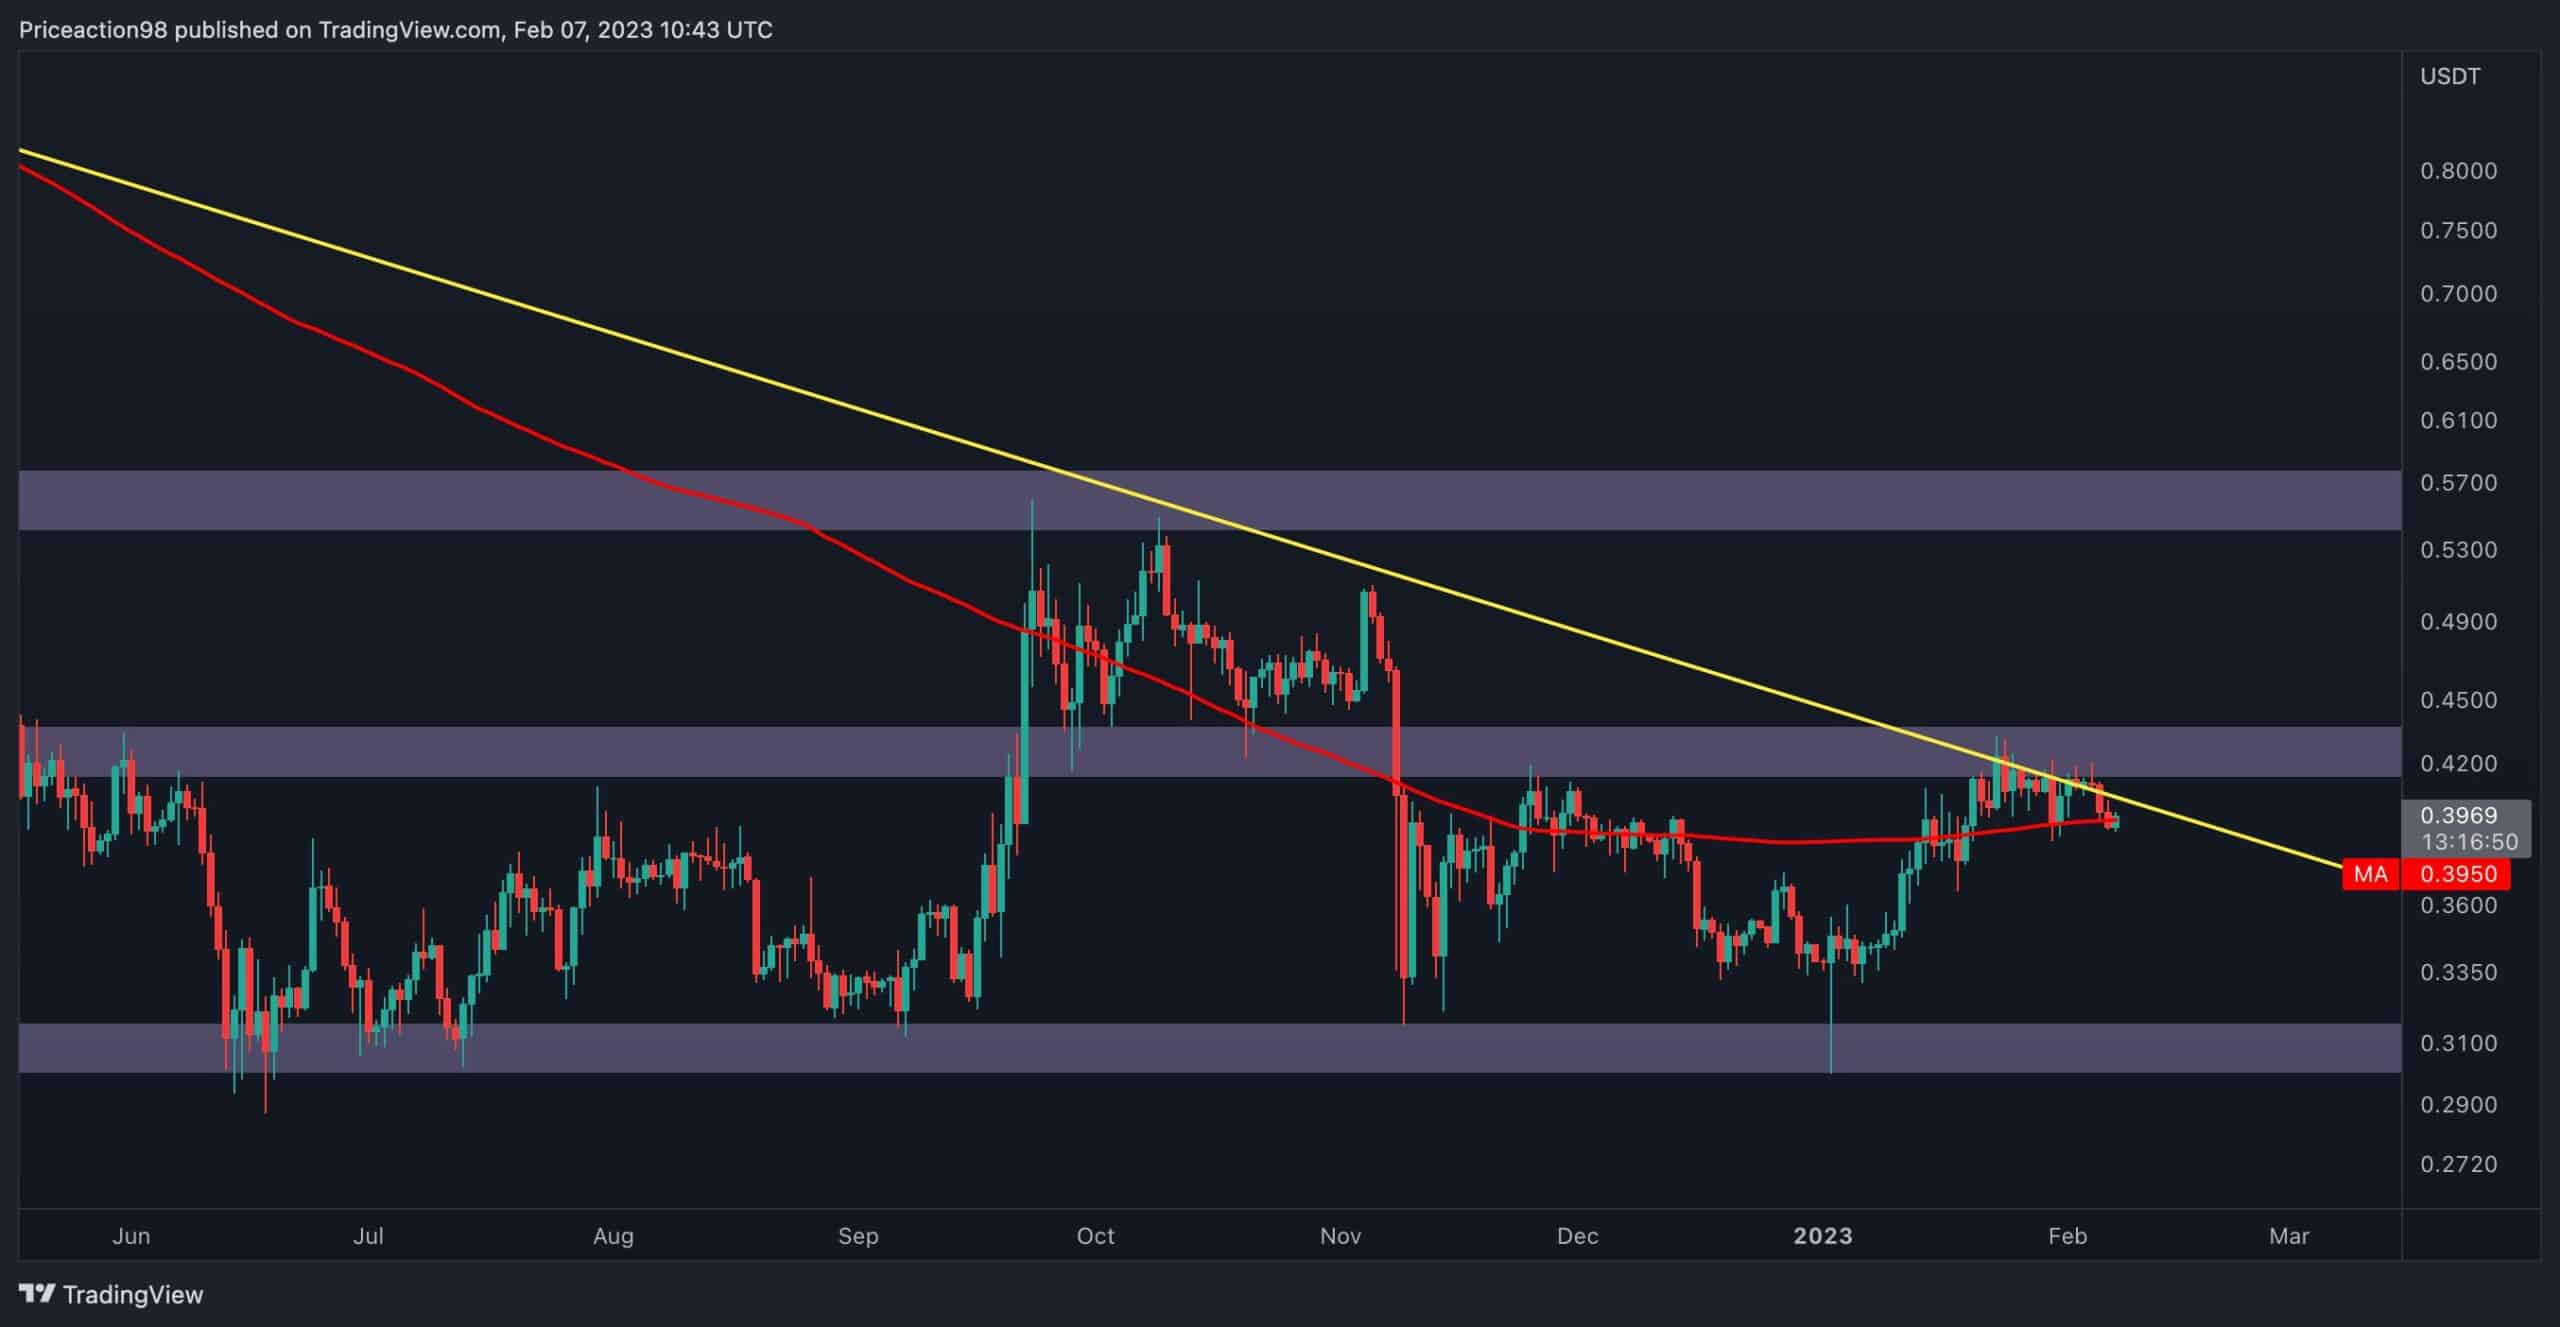
Ripple’s price action has been dull after failing to surpass the $0.42 substantial resistance level, which also aligns with the descending trendline.
The price plummeted slightly and reached the 200-day moving average at $0.395. Therefore, the cryptocurrency is stuck in a very tight range between $0.42 and $0.395. A breakout from this range will likely lead to an impulsive move, as there is an enormous amount of liquidity above and below it.
The 4-Hour Chart
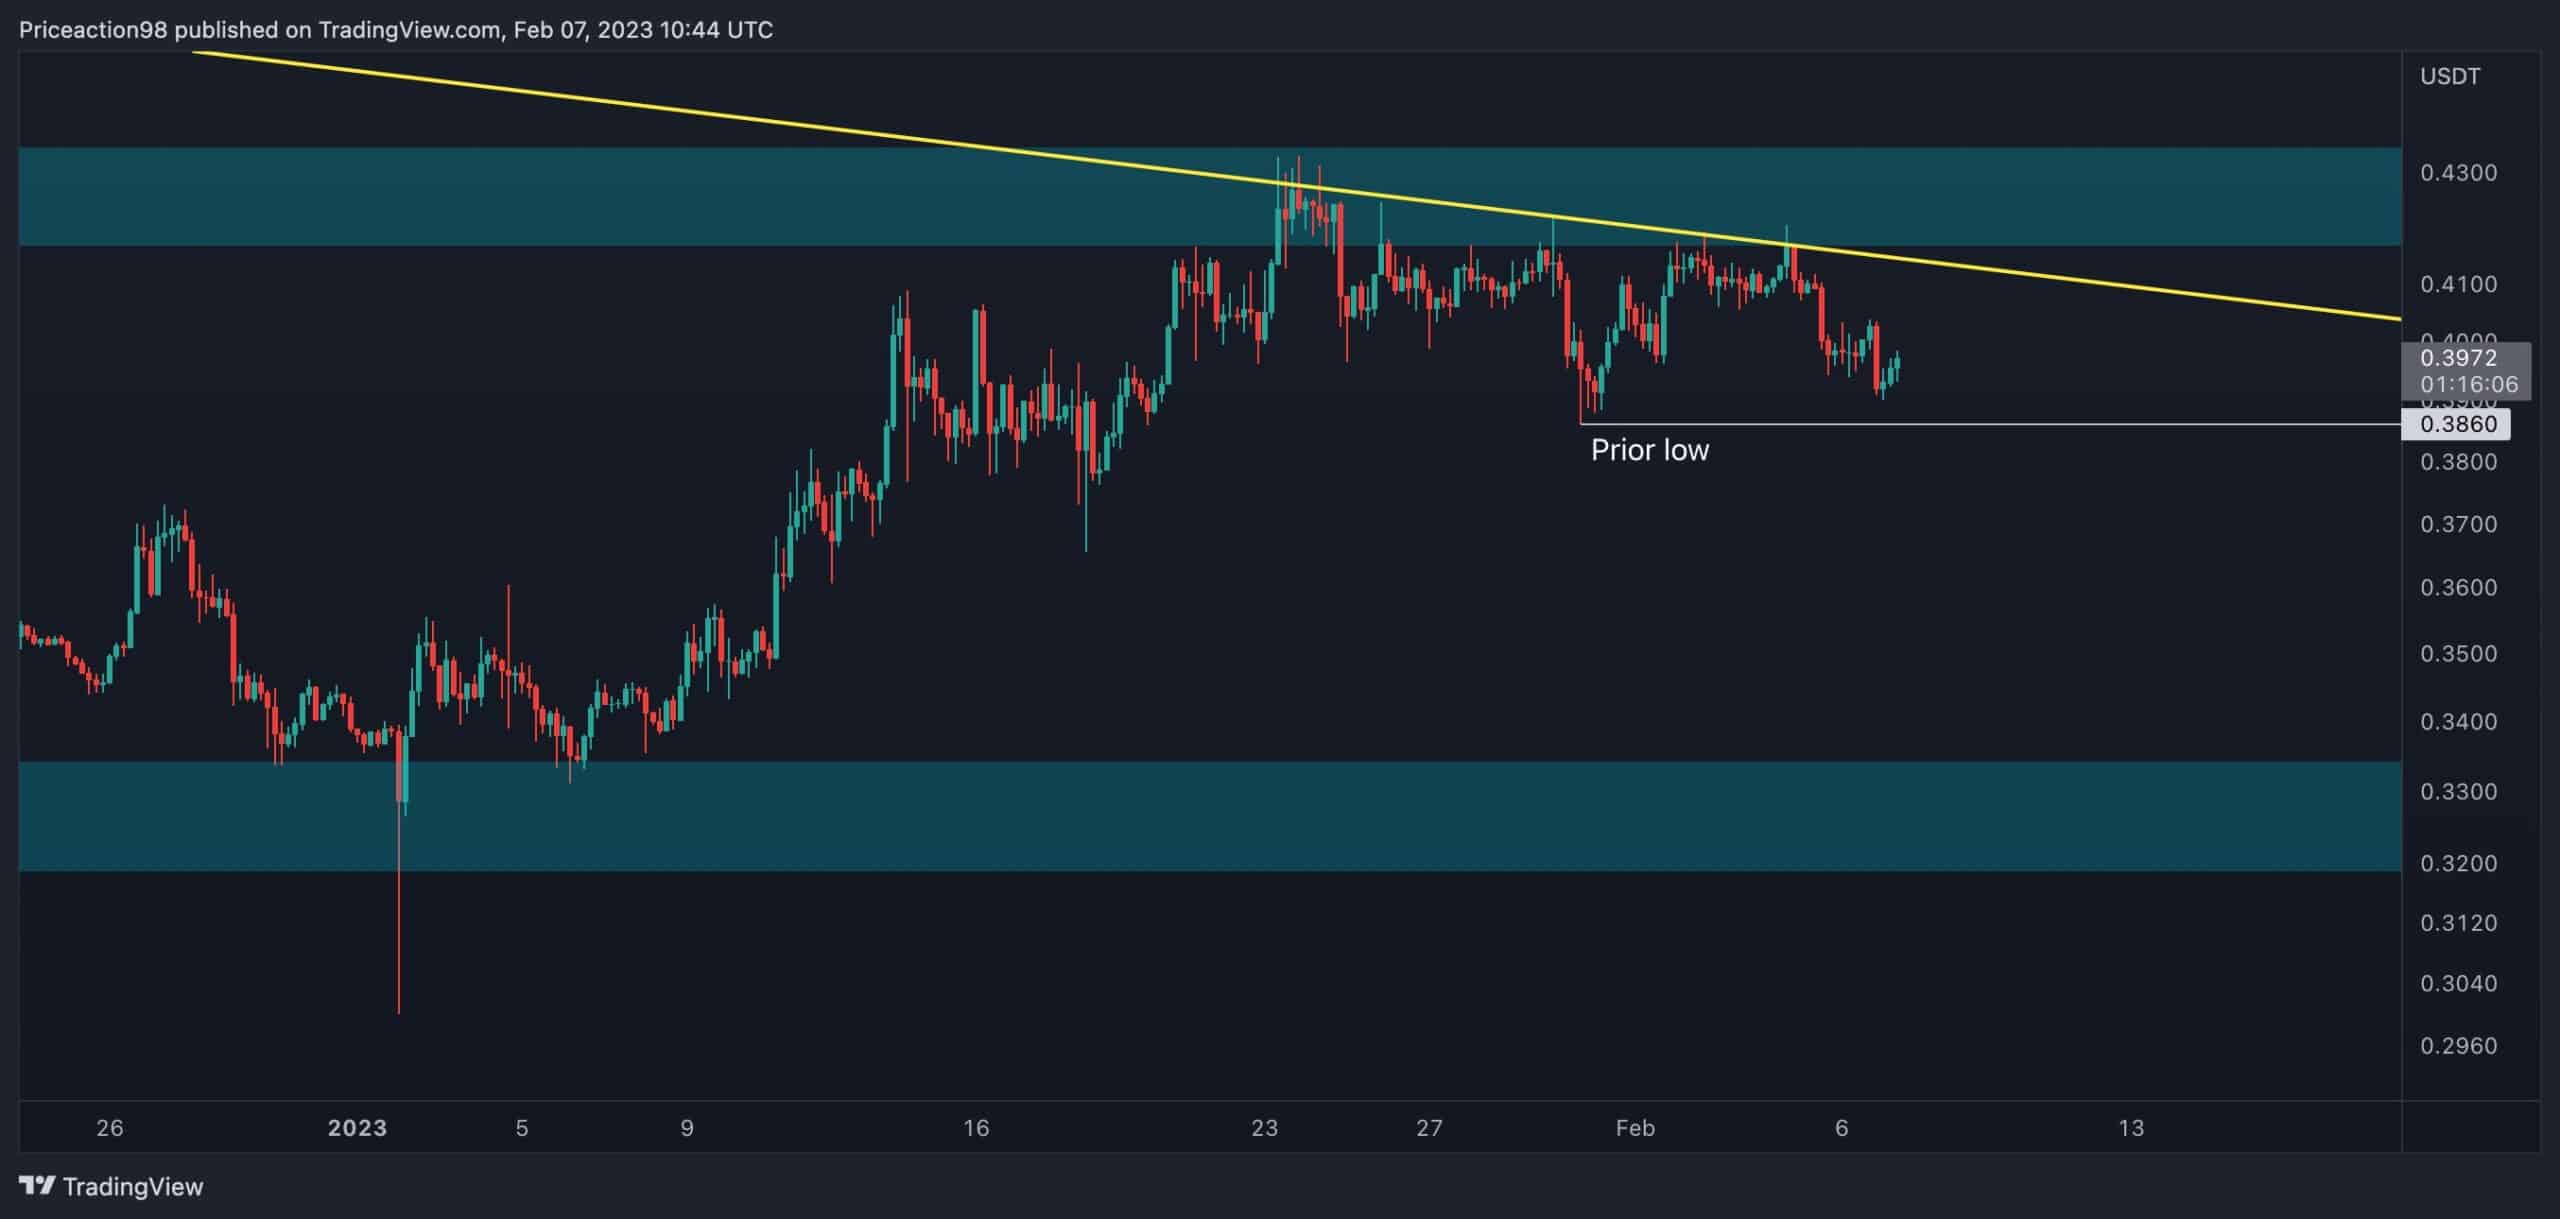
In the 4-hour timeframe, the weakened bullish momentum is evident as the price failed to print another higher high after reaching the $0.42 region and was rejected from the trendline after several attempts.
Nevertheless, the cryptocurrency faces a mid-range support level at $0.386, which is the prior central pivot. If XRP finds support at the mentioned level, the price might initiate a rally, attempting to surpass the trendline.
On the contrary, if it drops below its prior low, the uptrend will end, and the market should expect a reversal. In this case, Ripple’s next level of support will be the $0.33 region.
The post All Eyes on $0.40 as XRP Choppy Price Action Takes Hold (Ripple Price Analysis) appeared first on CryptoPotato.