After Breaking Below $1500, Where is the Bottom for ETH? (Ethereum Price Analysis)
Ethereum lost 20% of its value in the last three days and has performed much worse than Bitcoin. Speculations about the Celsius network liquidity crisis have intensified the panic sell. Where is the bottom?
Technical Analysis
Technical Analysis By Grizzly
The Daily Chart
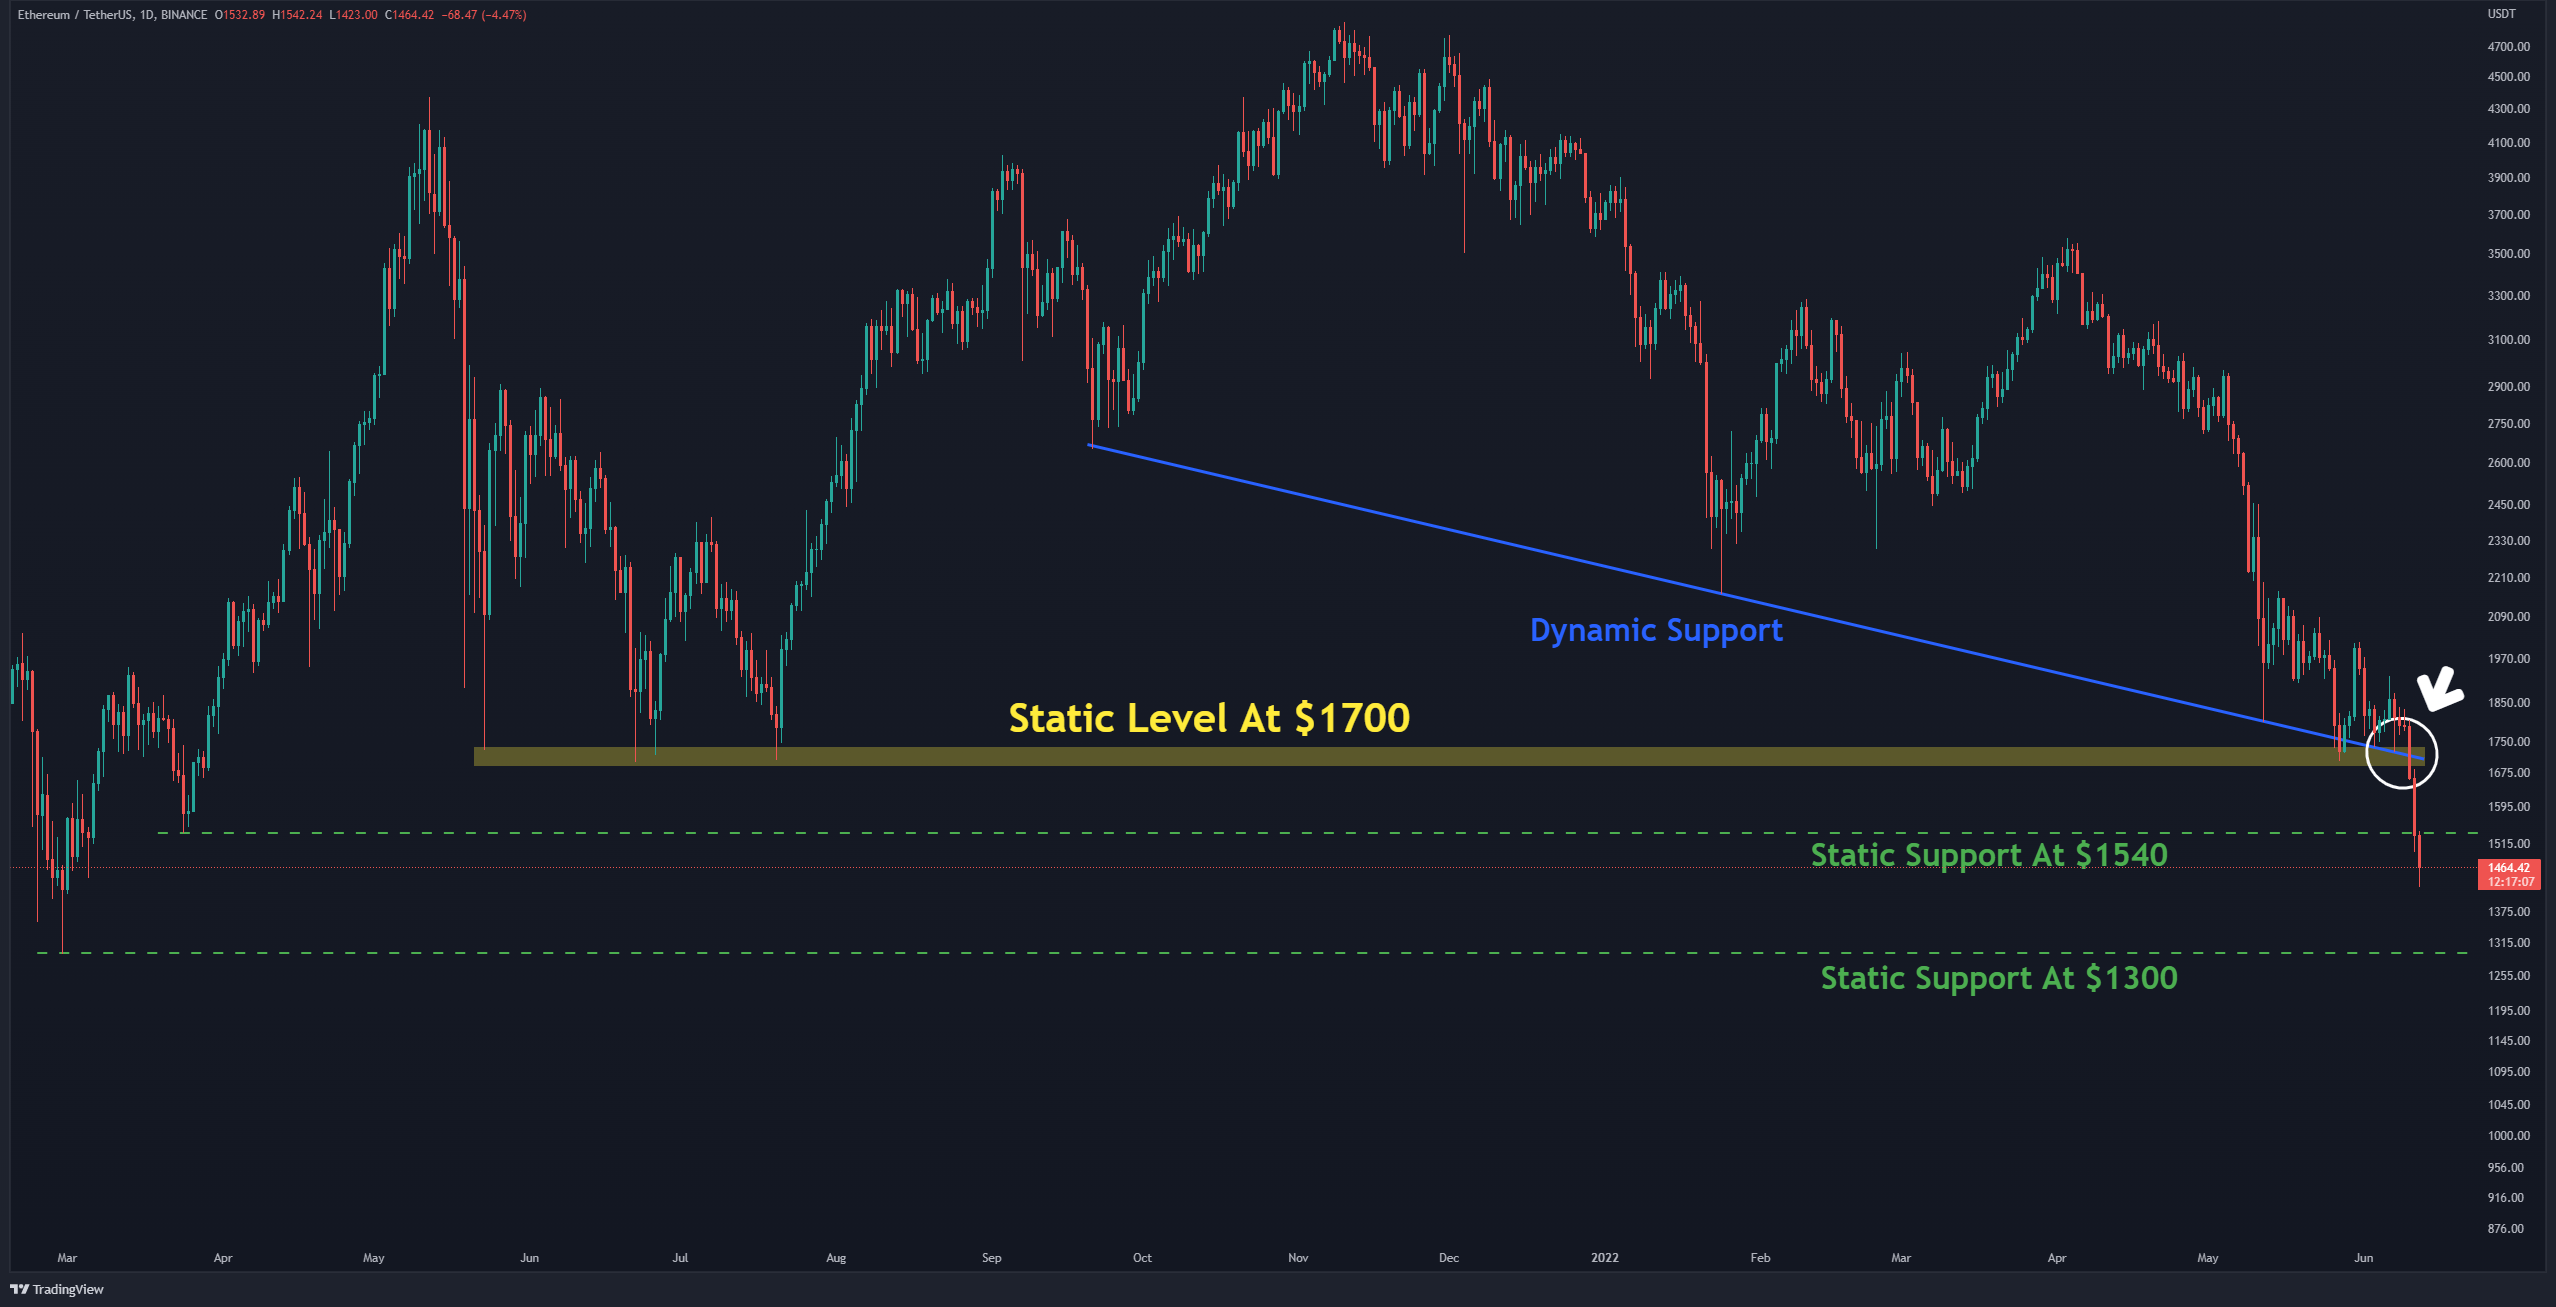
On the daily timeframe, the bears could finally push the price below the key support of $1,700 (marked yellow on the following chart). ETH is now trading at its lowest levels since March 2022.
At present, it is challenging to speculate whether we saw a market bottom. After breaking below the horizontal support at $1540, the next major level of support is expected around $1300. If the zone between $1300 – $1500, which contains 2018’s previous ATH, does not absorb the current selling pressure, ETH will likely retest the $1,000 for the first time after more than 500 days.
Key Support Levels: $1300 & $1040
Key Resistance Levels: $1500 & $1700

Moving Averages:
MA20: $1797
MA50: $2177
MA100: $2593
MA200: $2985
The ETH/BTC Chart
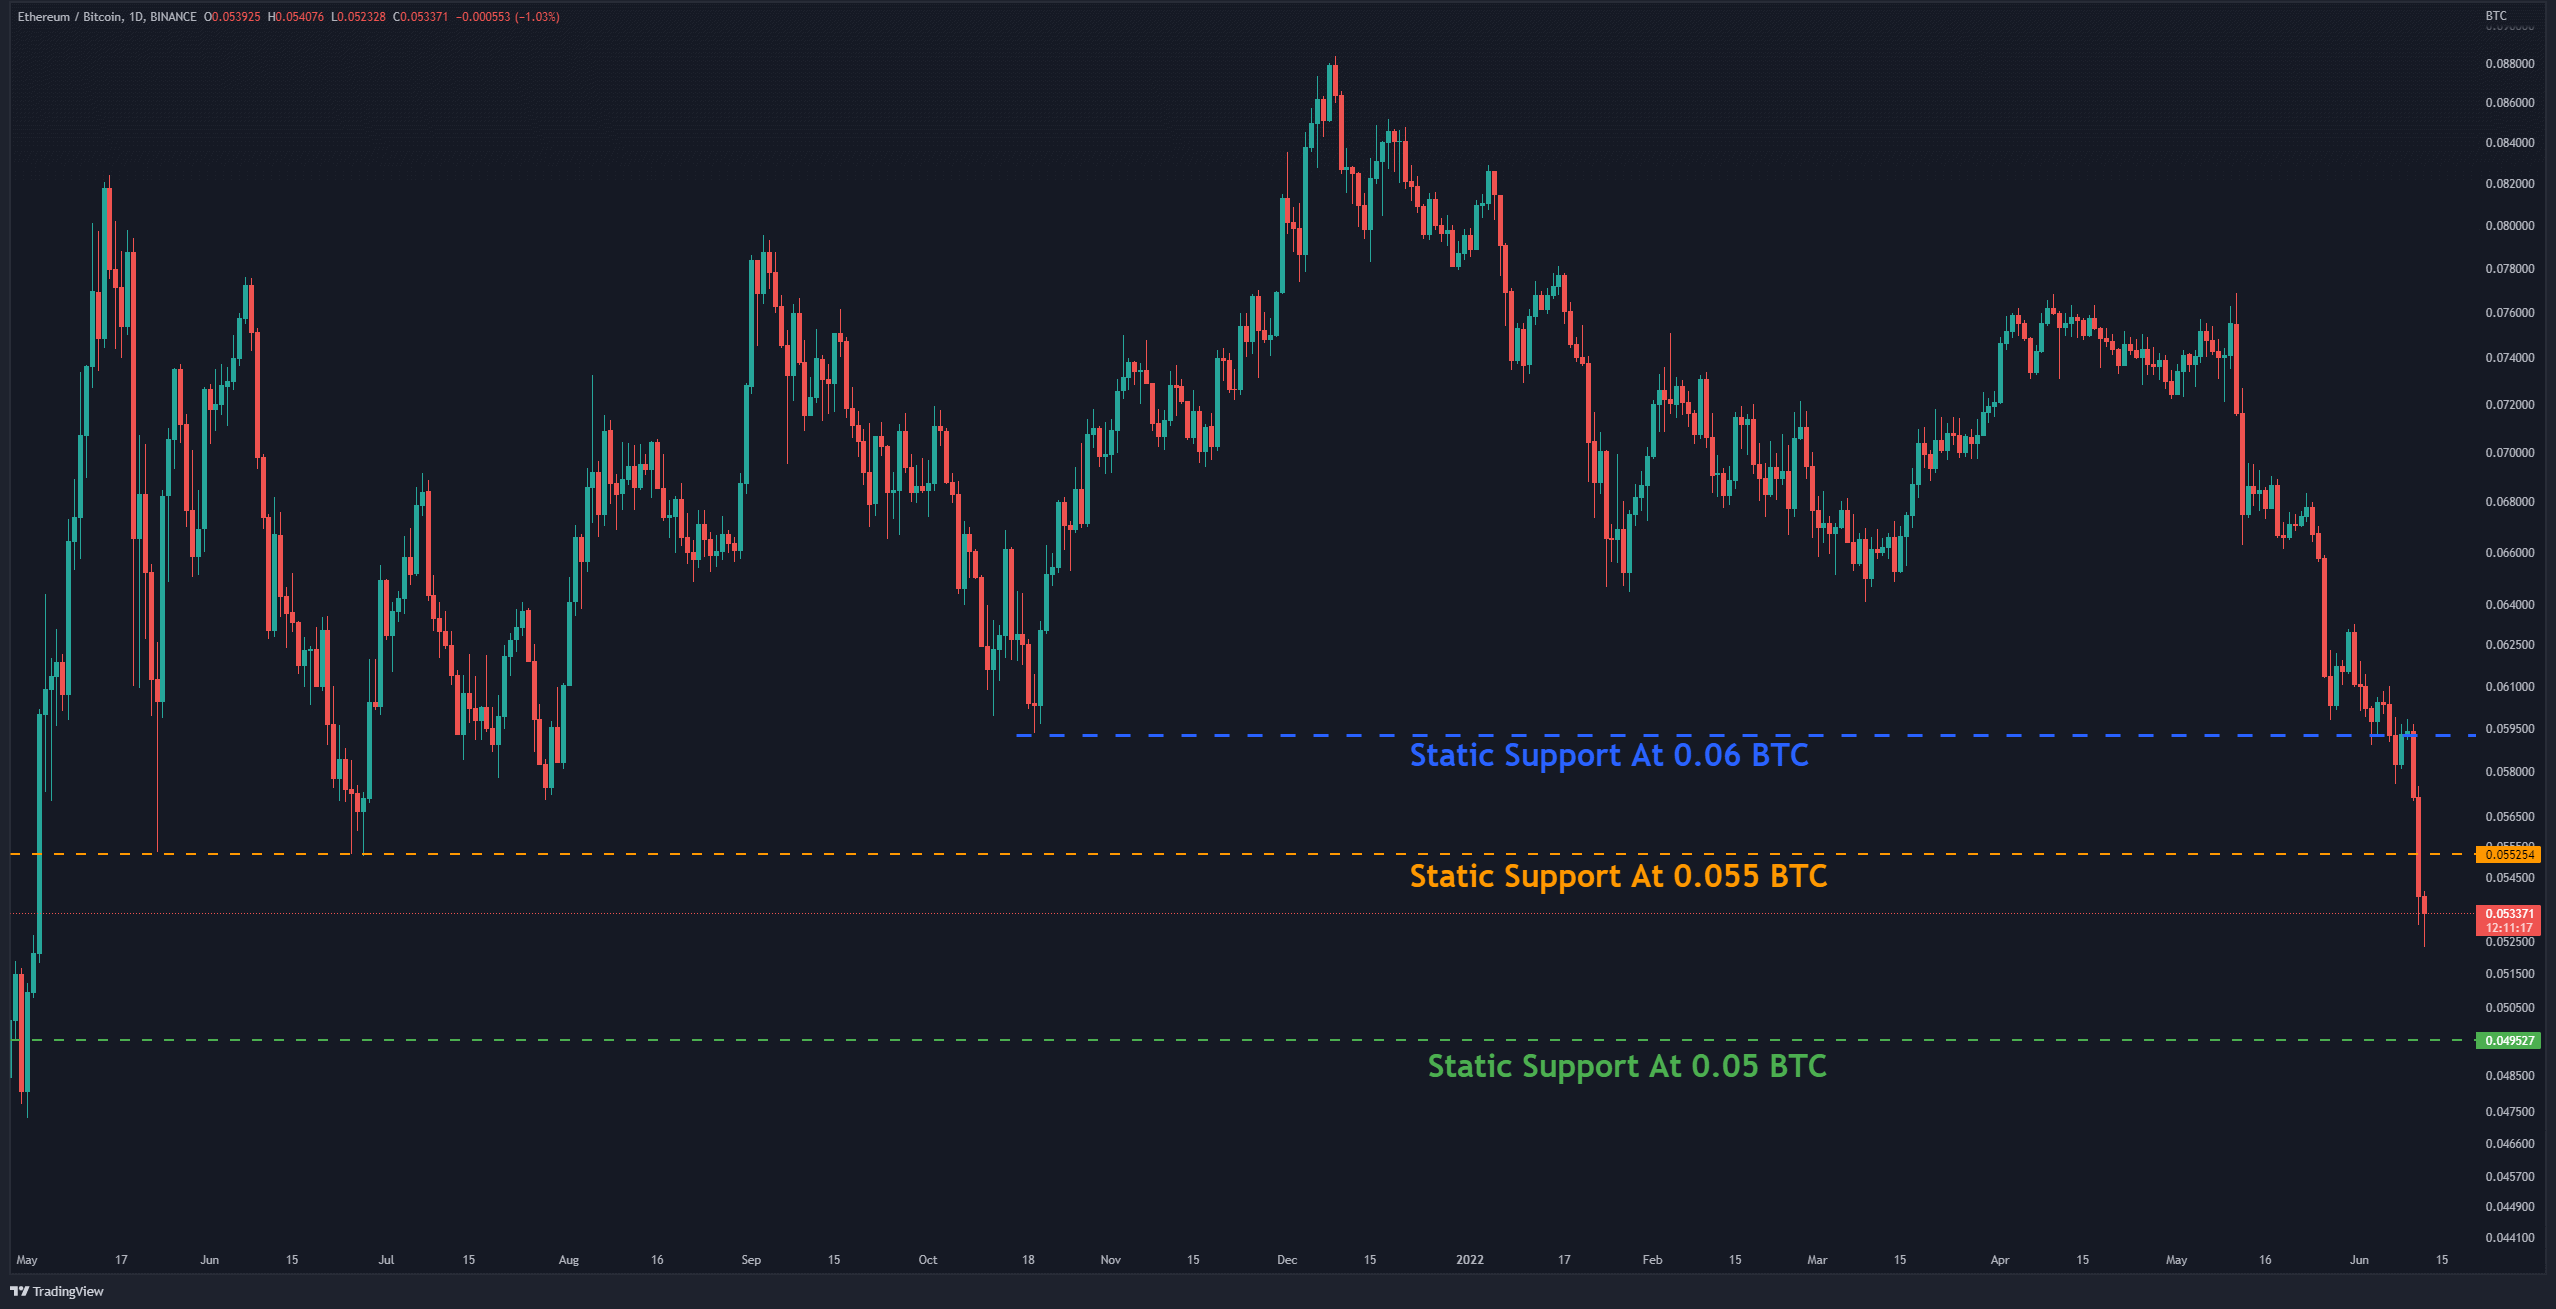
As expected and mentioned in our previous price analysis, the critical level at 0.055 BTC (in yellow) got broken down.
The overall market structure has become very bearish, without any significant positive sign of a possible trend reversal. If the negative sentiment continues, support at 0.05 BTC (in green) will probably be retested. The broken support levels now turned into strong resistance levels, as can be seen in the following chart:

Key Support Levels: 0.050 BTC & 0.0.045 BTC
Key Resistance Levels: 0.055 BTC & 0.06 BTC
On-chain Analysis: New Contracts (SMA 7)
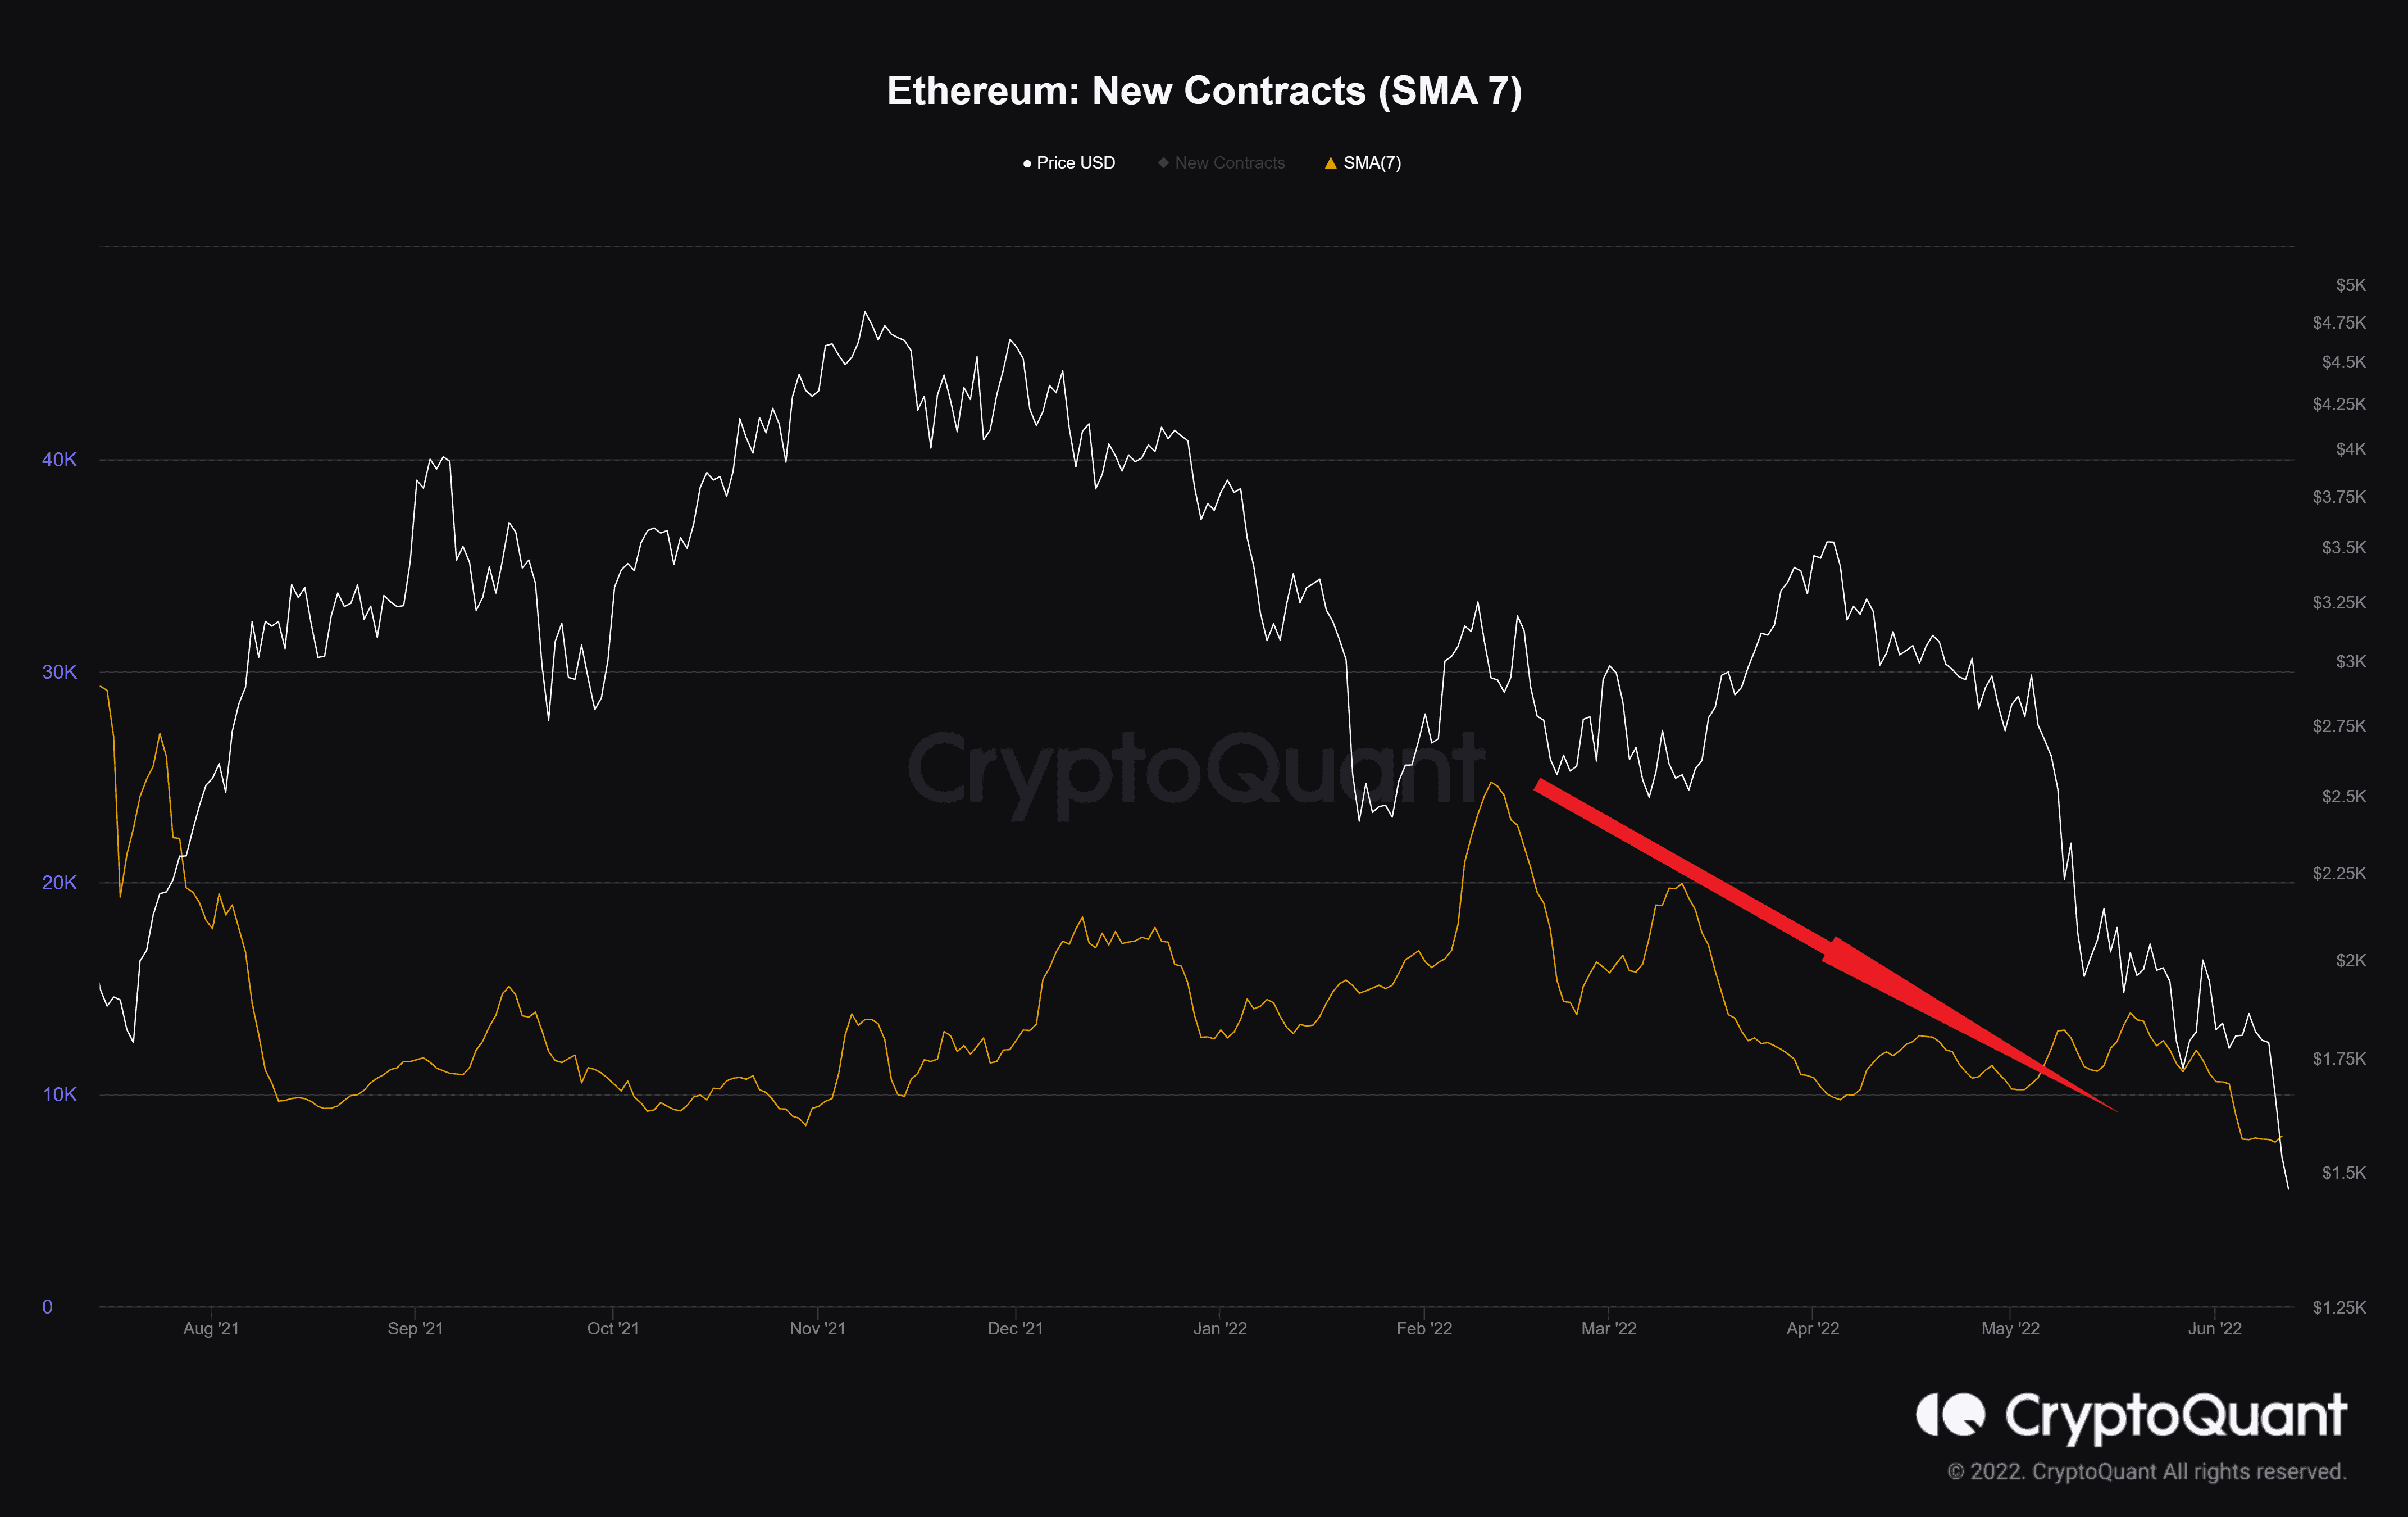
Definition: The number of newly created contracts in a given network.
In addition to investors and traders, developers seem to look at the situation of the Ethereum network these days.The number of newly created contracts on the network has reached the lowest level for months, and this is another very bearish signal.
A possible cause could be dapps and network participants, that likely prefer not to launch new projects on the ETH network amidst these bearish conditions.


