After Bitcoin’s $1500 Immediate Plunge, Is The 2020 Bull-Run Over? BTC Price Analysis
The past ten days, which were the last days of July, were a blessing for the price of Bitcoin.
Right after breaking out above the blue-marked trend line at $9200 on July 21st, Bitcoin started to fire its engines, and yesterday – following ten magic days – BTC price recorded a fresh 2020 high above $12,100. An incredible 31% increase.
And then it came: Immediately after recording the new high, we got the first significant correction since the 2020 parabolic run had started. And what a correction it was.
Only yesterday, we warned here:
“keep in mind that when possible price corrections come – it will hurt. Also, the indicators are overextended. The daily RSI is at its highest level since June 2019.”
Back To The $10,500 Prior High
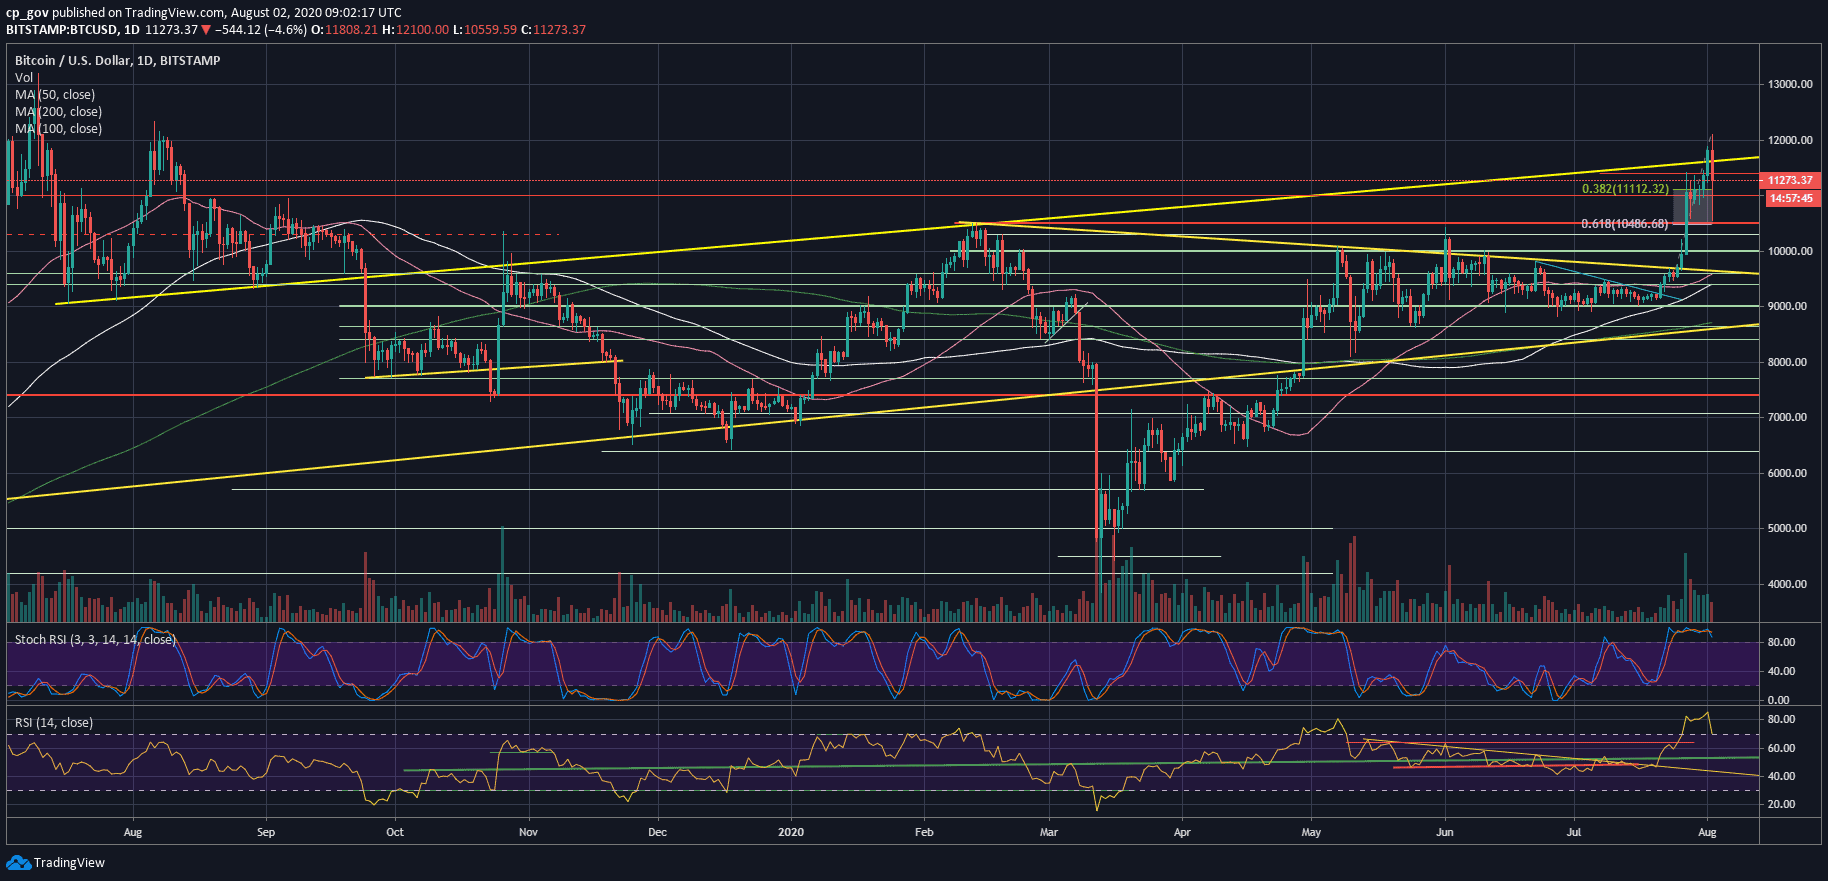
And it did hurt. In a matter of minutes, billions of long positions got liquidated, and from celebrating a new high at $12K, Bitcoin price plunged severely to $10,500 on most exchanges.
This is not a coincidence. In technical analysis of a healthy trend, strong resistance becomes strong support when breached, and as you might remember, the $10,500 was a tough resistance for Bitcoin while the level was holding as 2020 high since mid-February.
Besides, $10,500 is accurately the Golden Fibonacci retracement level following the last leg of the BTC rally. Thishis correction was anticipated as mentioned above, and so far it’s a healthy one on Bitcoin’s way “to the moon.”
In any case, Bitcoin quickly recovered as massive buy orders took care of the price dip, and as of now, Bitcoin is trading around $11,200 – $11,300.
Another thing to note, we mentioned how significant is the yellow ascending trend-line around $11,650. As can be witnessed in the daily chart below, this line begun forming a year ago. Bitcoin could not hold above this trend-line for more than one day.
Key Levels To Watch: Support and Resistance
Following the plunge, Bitcoin is now facing the good old $11,400 (the high from last Monday) as the first resistance level to watch.
In case of a breakout, then the mentioned yellow line around $11,650 is the next major resistance. This is followed by $11,800 (resistance from March 2018) and the psychological level of $12,000 – $12,100 (yesterday’s 2020 record high).
From below, the first level of support now lies at $11,100 (38.2% Fib retracement level) and $11,000. This is followed by $10,800 and today’s low of $10,500.
Total Market Cap: $340.3 billion
Bitcoin Market Cap: $207.8 billion
BTC Dominance Index: 61.1%
*Data by CoinGecko
BTC/USD BitStamp 1-Day Chart

The post After Bitcoin’s $1500 Immediate Plunge, Is The 2020 Bull-Run Over? BTC Price Analysis appeared first on CryptoPotato.


