After 6-Month Bitcoin Price Had Reached $6000 (Again): How High Can BTC Climb From Here?
It took the king of the cryptocurrencies almost six months, but finally, Bitcoin made it and reached the $6000 mark! The last time Bitcoin saw a prefix of $6000 was on November 14, 2018.
Over the past 48 hours, since we had published our last updated, Bitcoin continued to show high levels of volatility: The coin recorded a low of $5565 just yesterday, however, in today’s early morning the $6000 target was captured.
As of writing this, Bitcoin reached a high of $5970 (Bitstamp) and quickly got rejected. As of now, the coin is trading around $5880.
As mentioned before, the $5700 – $6000 area should be serving as a tough resistance for Bitcoin. However, almost anything is possible in crypto, including daily 2-digit gains and losses for Bitocin.
Total Market Cap: $188 Billion
Bitcoin Market Cap: $104.9 Billion
BTC Dominance: 55.8%
Looking at the 1-day & 4-hour charts
– Support/Resistance:
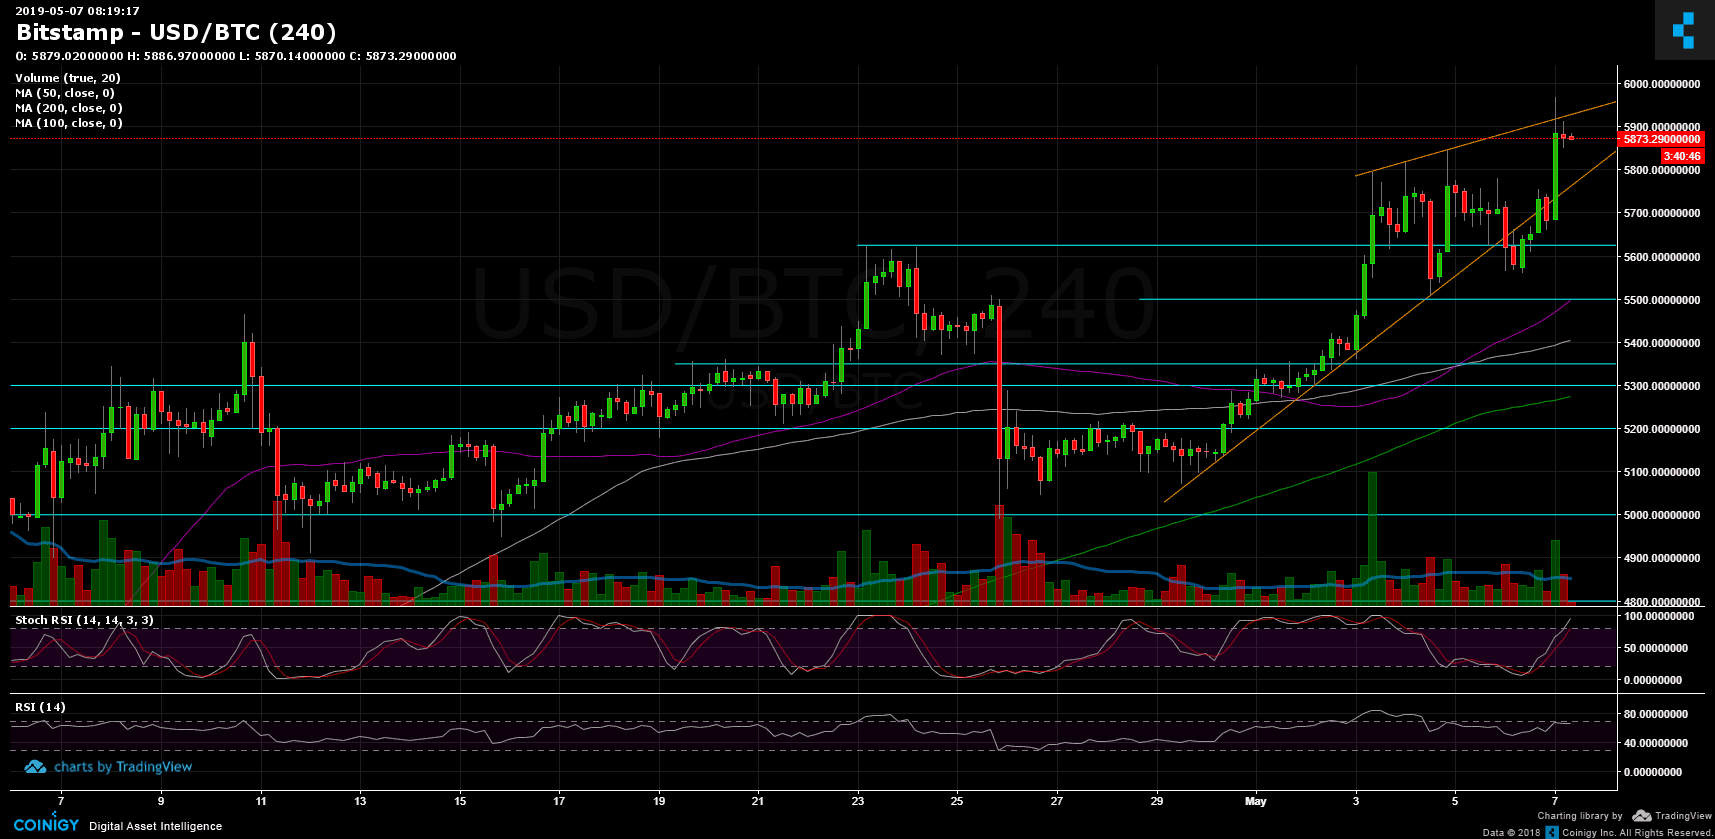
As of now, Bitcoin is inside the boundaries of the $5700 – $5800 area. This can quickly turn into a false breakout. However, in case Bitcoin holds here, the next (weak) resistance lies at current prices of $5900, before reaching the $6000 zone. Further resistance lies at $6200 – $6250 and $6400.
From below, the $5700 is the closest resistance turned support area. Below lie $5625 and $5500 levels. Further below is the $5300 – $5350 significant support zone.
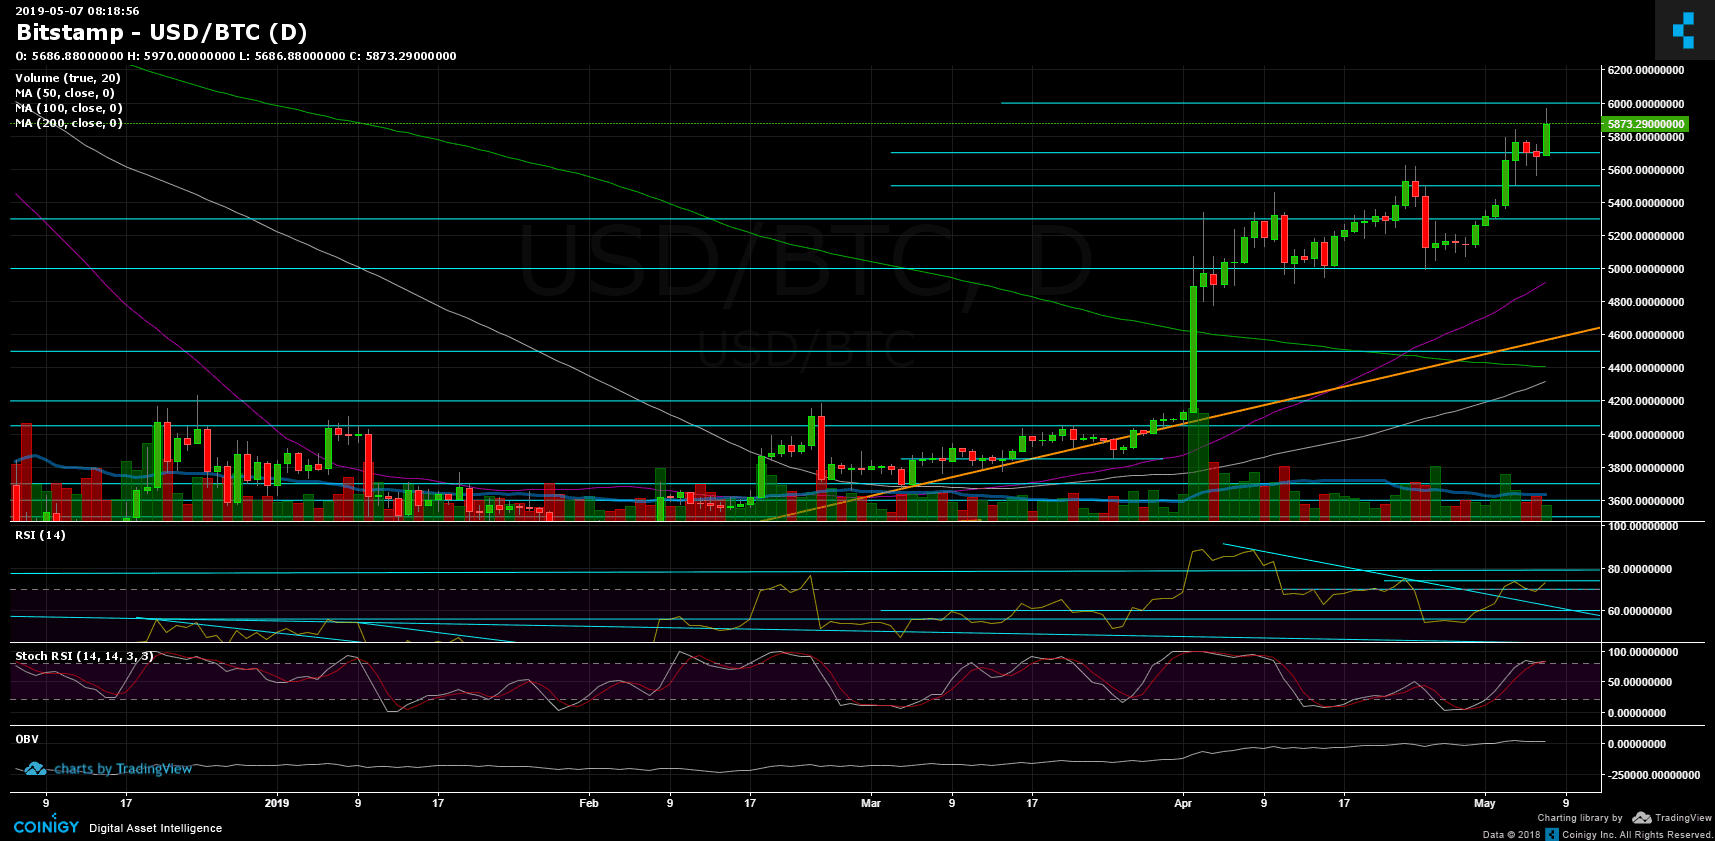
– Trading Volume: displayed below is the last 6-month daily volume among the top crypto exchanges. As can be seen, besides the beginning of April, the recent days were not followed by the amount of volume I would expect for a breakout.

– Daily chart’s RSI: After retesting the 70 RSI level as support, the RSI had turned bullish and now facing 74 as resistance. We will remind here the negative divergence in the daily chart’s RSI, which could easily turn into a bearish sign for the mid or long-term. Besides, Stochastic RSI oscillator is about to produce a cross-over in the overbought territory. The last suggest that a correction is coming in the next days.
– BitFinex open short positions: BTC short positions had recorded their monthly high of 31.8K BTC of open positions.
BTC/USD BitStamp 4-Hour Chart
BTC/USD BitStamp 1-Day Chart
The post After 6-Month Bitcoin Price Had Reached $6000 (Again): How High Can BTC Climb From Here? appeared first on CryptoPotato.