ADA Skyrockets 16% Daily, Here’s the Next Major Target (Cardano Price Analysis)
Cardano’s price increased by a whopping 30% in the past seven days, charting the majority of these gains in the last 24 hours.
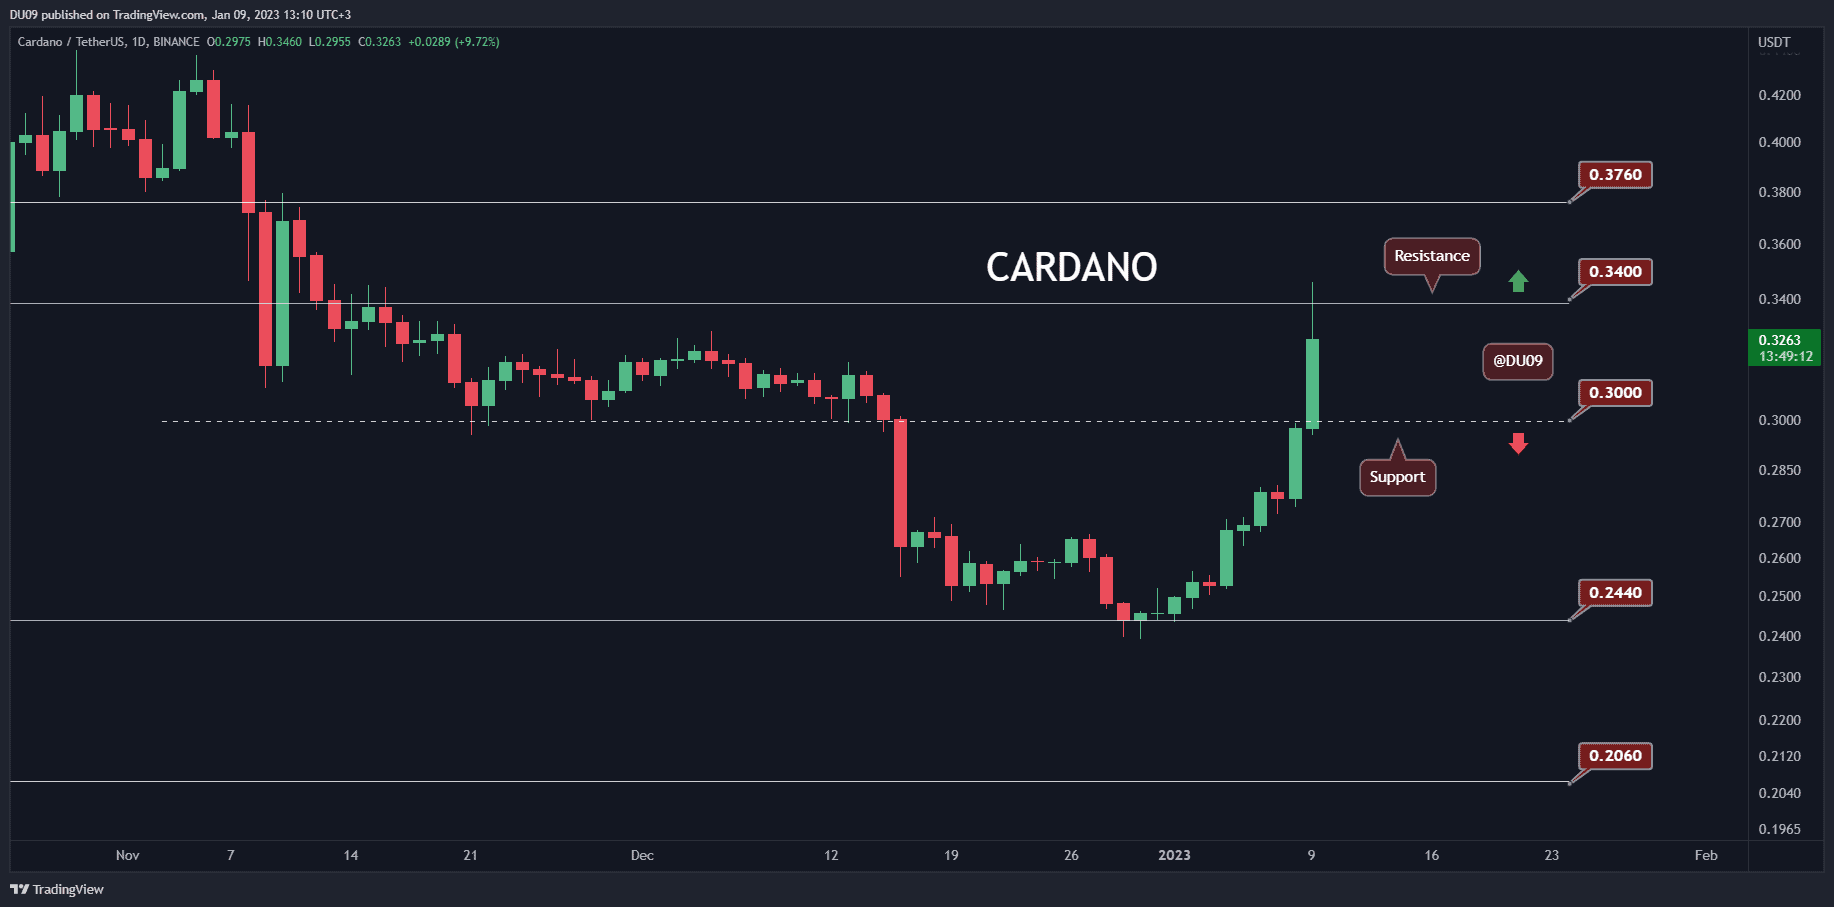
Key Support levels: $0.30, $0.24
Key Resistance levels: $0.34, $0.38
Cardano did not disappoint and started this week with a massive rally booking, a 16% price increase in the past 24h. In the process, ADA turned the $0.30 resistance into support. This pushed the price all the way to $0.34, which will likely be a difficult level to break.
At the time of this post, the bears have managed to reject the price at the key resistance. It remains to be seen if the rally will sustain.
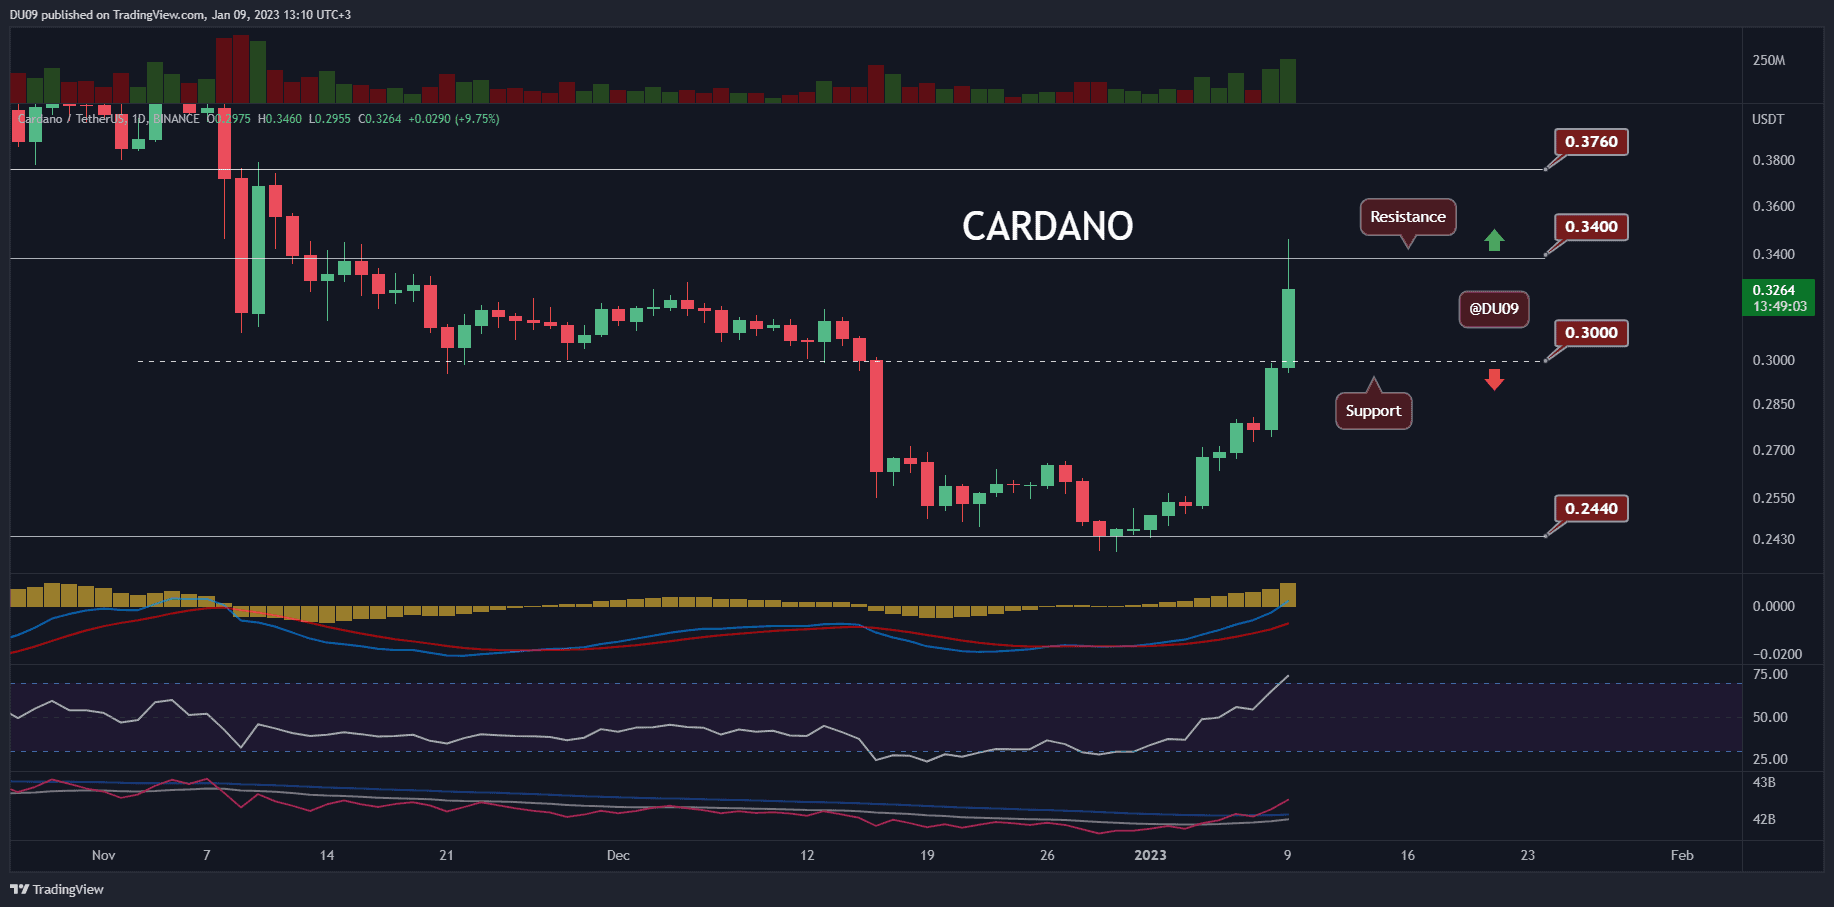
Trading Volume: The volume exploded during this rally, reaching levels not seen since November 2022.
RSI: Surprisingly, the daily RSI is in the overbought territory at 73 points. This signals a strong bullish momentum.
MACD: The daily MACD is bullish, and the histogram is making higher highs. So long as this continues, the bias would remain positive.
Bias
The bias for ADA is bullish.
Short-Term Prediction for ADA Price
The biggest challenge for ADA is to break above the $0.34 resistance level. If successful, then it could quickly approach 38 cents, where it will likely face another pushback from bears. The support at $0.30 is the first barrier to halt any selling pressure, should it come.
The post ADA Skyrockets 16% Daily, Here’s the Next Major Target (Cardano Price Analysis) appeared first on CryptoPotato.