ADA Price Analysis: Cardano Drops Below $1 Following 20% Weekly Decline
Cardano was no exception to the market’s decline. After it failed to break out of the descending channel (marked yellow), the bears were able to push the price what the next destination is.
Technical Analysis
Technical Analysis By Grizzly
The Daily Chart:
On the daily timeframe, Cardano is moving down in a descending channel and has corrected from the recent 60% spike to the Fibonacci Retracement at 0.618. The most important for the bulls is to push the price back above $1, which now acts as a resistance (marked blue). If this happens, one can hope to retest the top of the channel; otherwise, the supports at $0.86 and $0.68 are zones that have the potential to reverse the trend.
RSI 30d indicator is also moving in the bearish area but still holds ascending line (marked green)
Moving Averages:
MA20: $1.11
MA50: $0.96 (Cardano is here now)
MA100: $1.05
MA200: $1.43

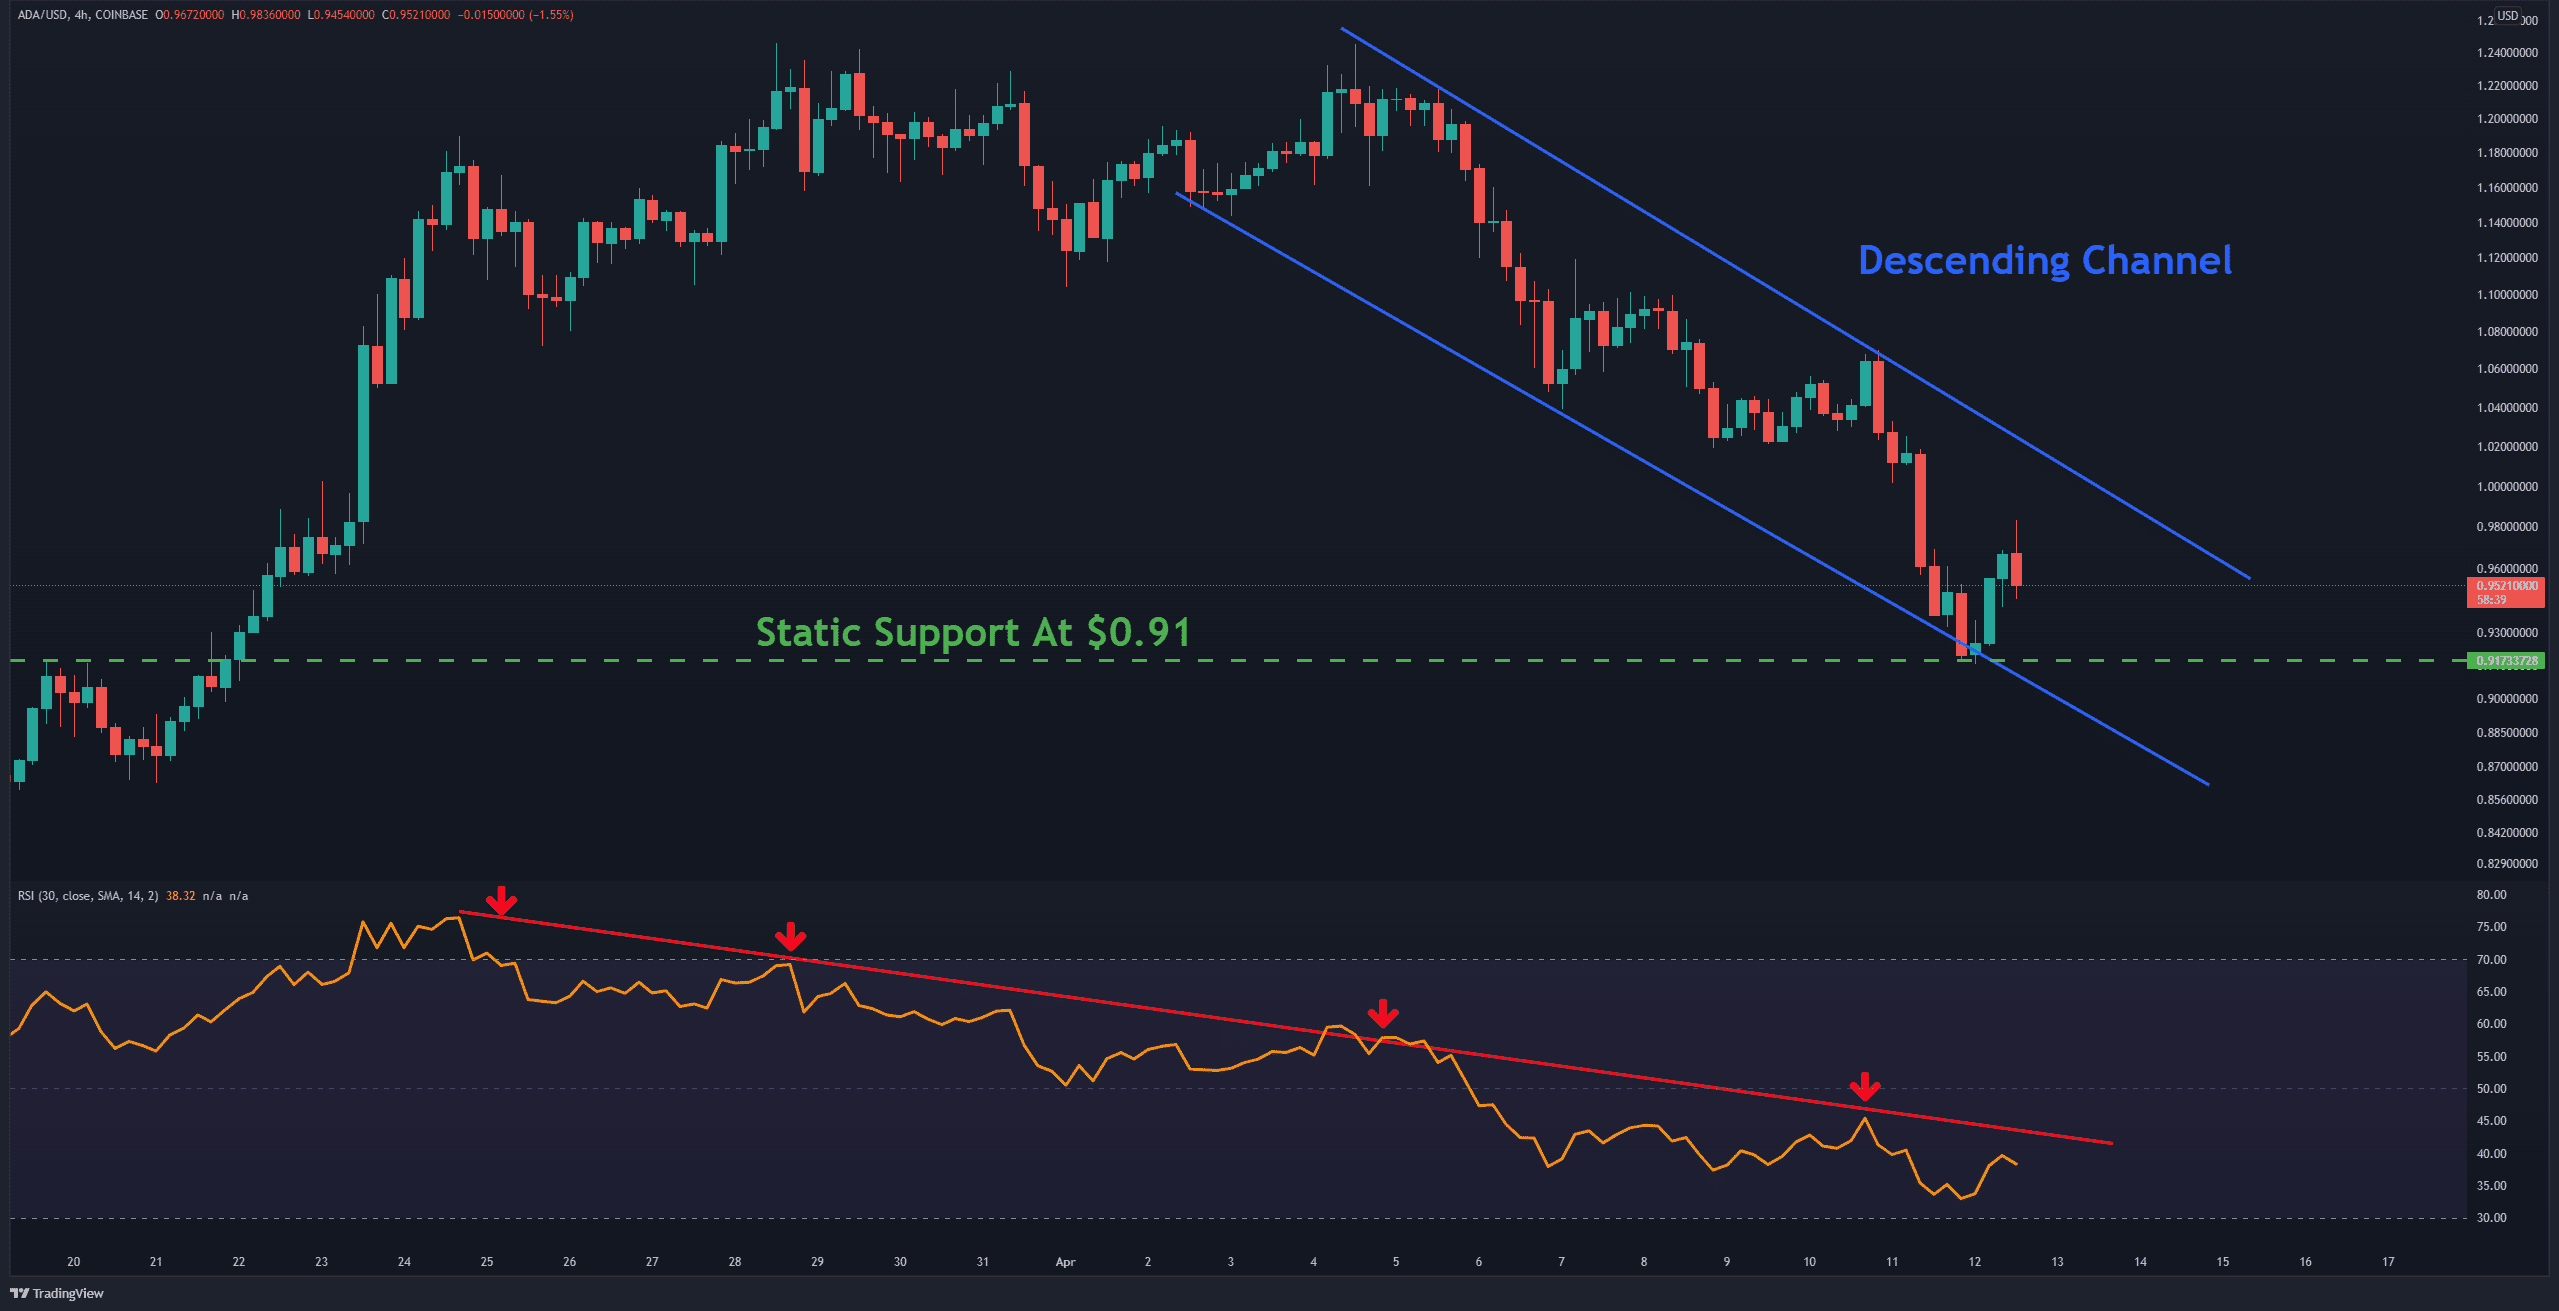
The 4-Hour Chart:
On the 4-hour timeframe, as the daily timeframe, Cardano is trading in a descending channel (marked blue), with the bottom on the short-term horizontal support being at $0.91.
As long as the price does not break out of this channel and the RSI 30 indicator moves below the descending line, one can not expect significant growth from the price. Price is expected to fluctuate widely in this zone.