ADA Price Analysis: Cardano Attempts to Break Above $1.2, How High Can It Go?
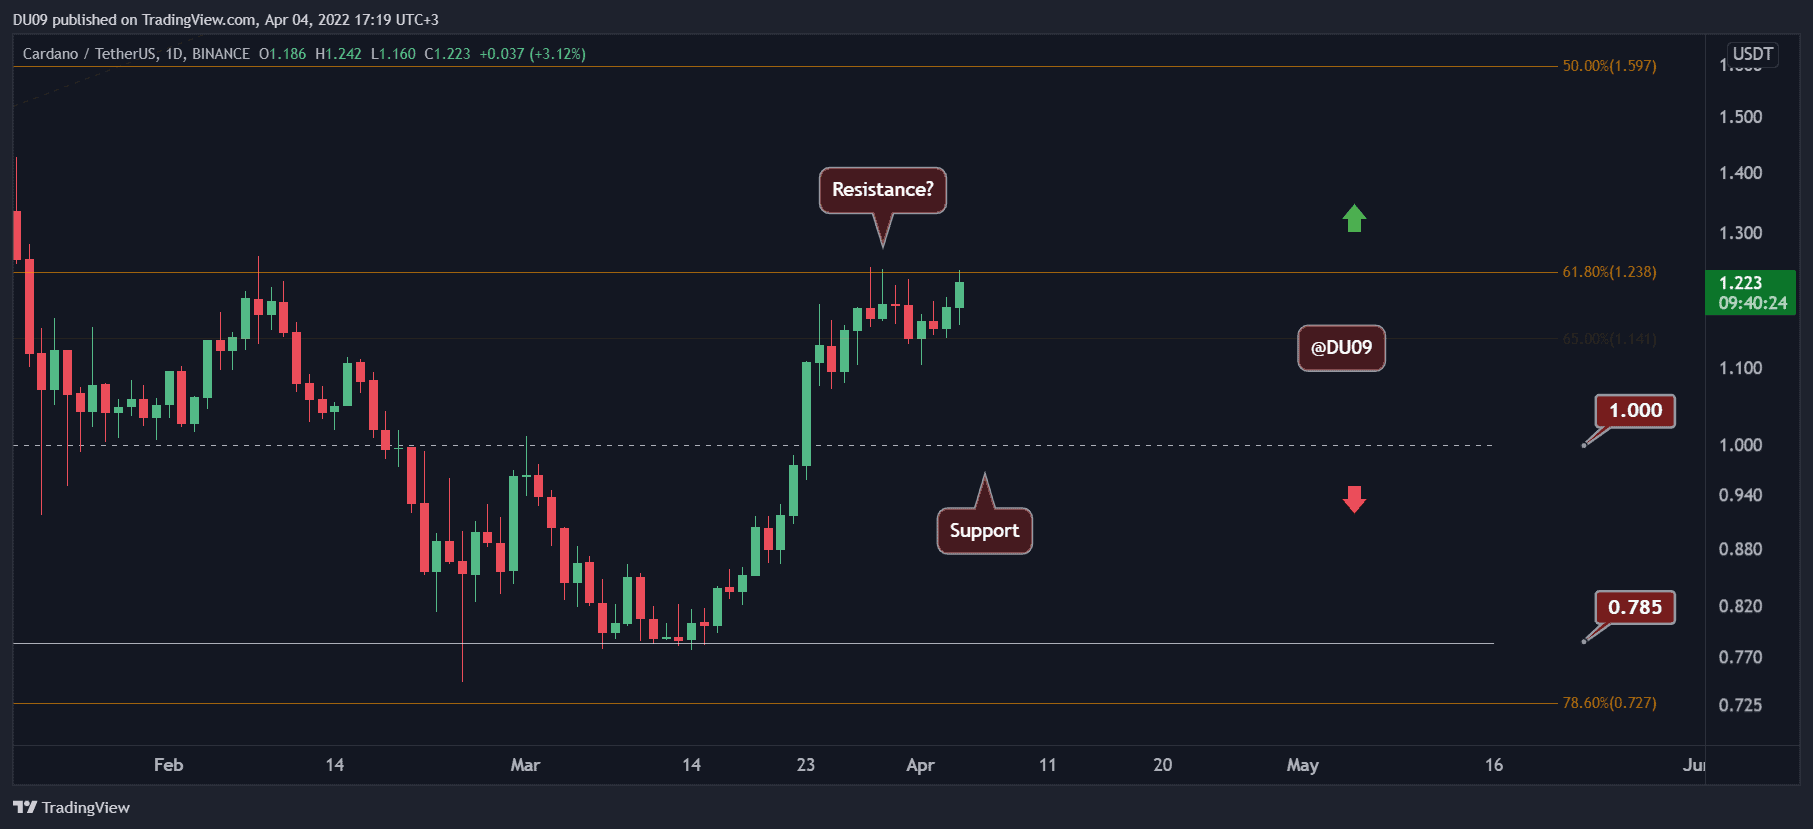
Key Support levels: $1, $0.78
Key Resistance levels: $1.2, $1.6
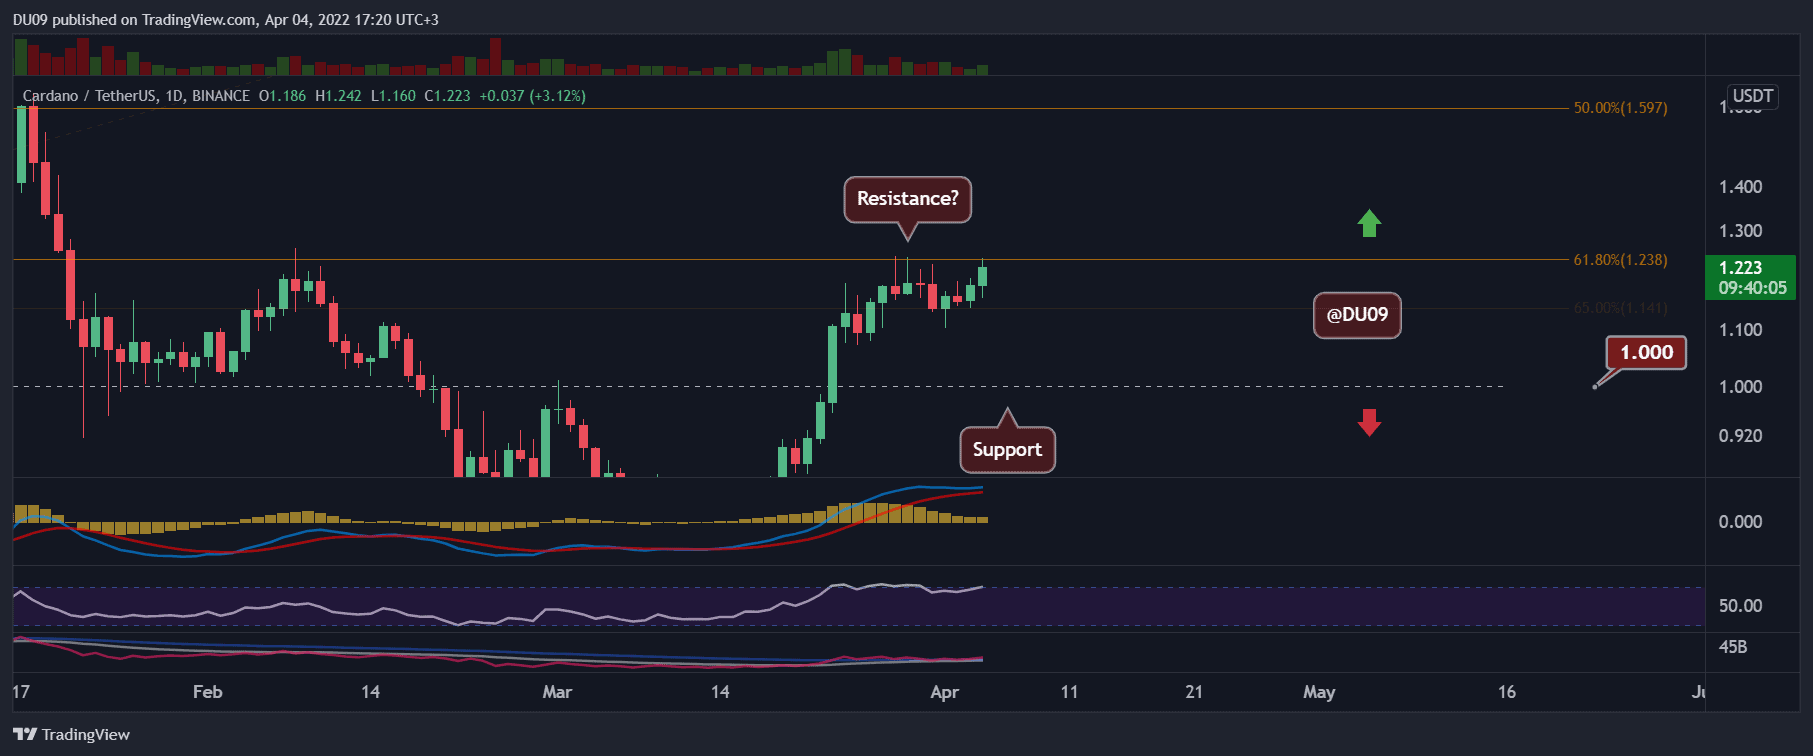
ADA’s bullish momentum continues with the price challenging the $1.2 resistance. The following major resistance after that would be at $1.6. The support at $1 seems less likely to be retested as $1.2 will turn into support if this price action is maintained.
Technical Indicators
Trading Volume: The volume is not great. Therefore, the strength of this push may come into question if it doesn’t pick up.
RSI: The daily RSI is quickly moving into the overbought area (>70 points). The RSI has to make a higher high to signal confidence in the current run.
MACD: The daily MACD is bullish and is curving back up again. This is good news, but the bulls have to maintain the buying pressure.
Bias
The bias for ADA is bullish.
Short-Term Prediction for ADA Price
After a short pullback, ADA seems keen to move higher again. If the price manages to turn $1.2 into support, then Cardano will have a clearer path to a higher valuation. The indicators support a bullish bias, but more volume would be welcomed to increase the confidence in this move.


