A New Metric to Evaluate Crypto Ecosystem Fundamentals
When evaluating layer-1 (L1) blockchains, many fundamental investors focus on metrics such as price-to-earnings or price-to-sales ratios. While these metrics are important, they ignore the programmable aspect of a blockchain’s token supply. Because a blockchain’s emissions schedule (i.e., when new tokens will enter circulation due to staking rewards and token unlocks) is known, its cost structure into the future is essentially known as well.
The years-to-profitability (YTP) ratio is a useful new metric for analyzing an L1’s profitability as it incorporates the blockchain’s forward supply curve. It applies the traditional finance (TradFi) concepts of breakeven analysis and payback periods to crypto. The analysis views an L1 blockchain through the lens of a business that sells secured blockspace. Revenues are the fees that users pay to record transactions on the chain, and expenses are the costs needed to secure the network. YTP calculates a blockchain’s profitability timeline by factoring in the protocol’s current revenue and cost structure, a projected growth rate (CAGR) and future supply dynamics.
You’re reading Crypto Long & Short, our weekly newsletter featuring insights, news and analysis for the professional investor. Sign up here to get it in your inbox every Wednesday.
We find YTP compelling because it provides a comprehensive framework for evaluating an individual blockchain or comparing multiple blockchains.
We start our calculation with Token Terminal’s definition of L1 profitability:

It is important to note that all revenues and costs are denominated in the L1’s native token. And, while unlocks and staking rewards both increase the number of tokens in circulation, the difference between transaction fees and the portion of those fees paid to proof-of-stake validators is what is used to burn or reduce the number of tokens in circulation. In this sense, YTP measures the point at which an L1’s circulating supply stabilizes at 0% inflation. Some broad assumptions we make are:
-
The percentage of the transaction fee burned remains constant.
-
The foundation takes 10 years to sell all its tokens.
-
For revenues, we use the L1’s revenue for the last quarter annualized.
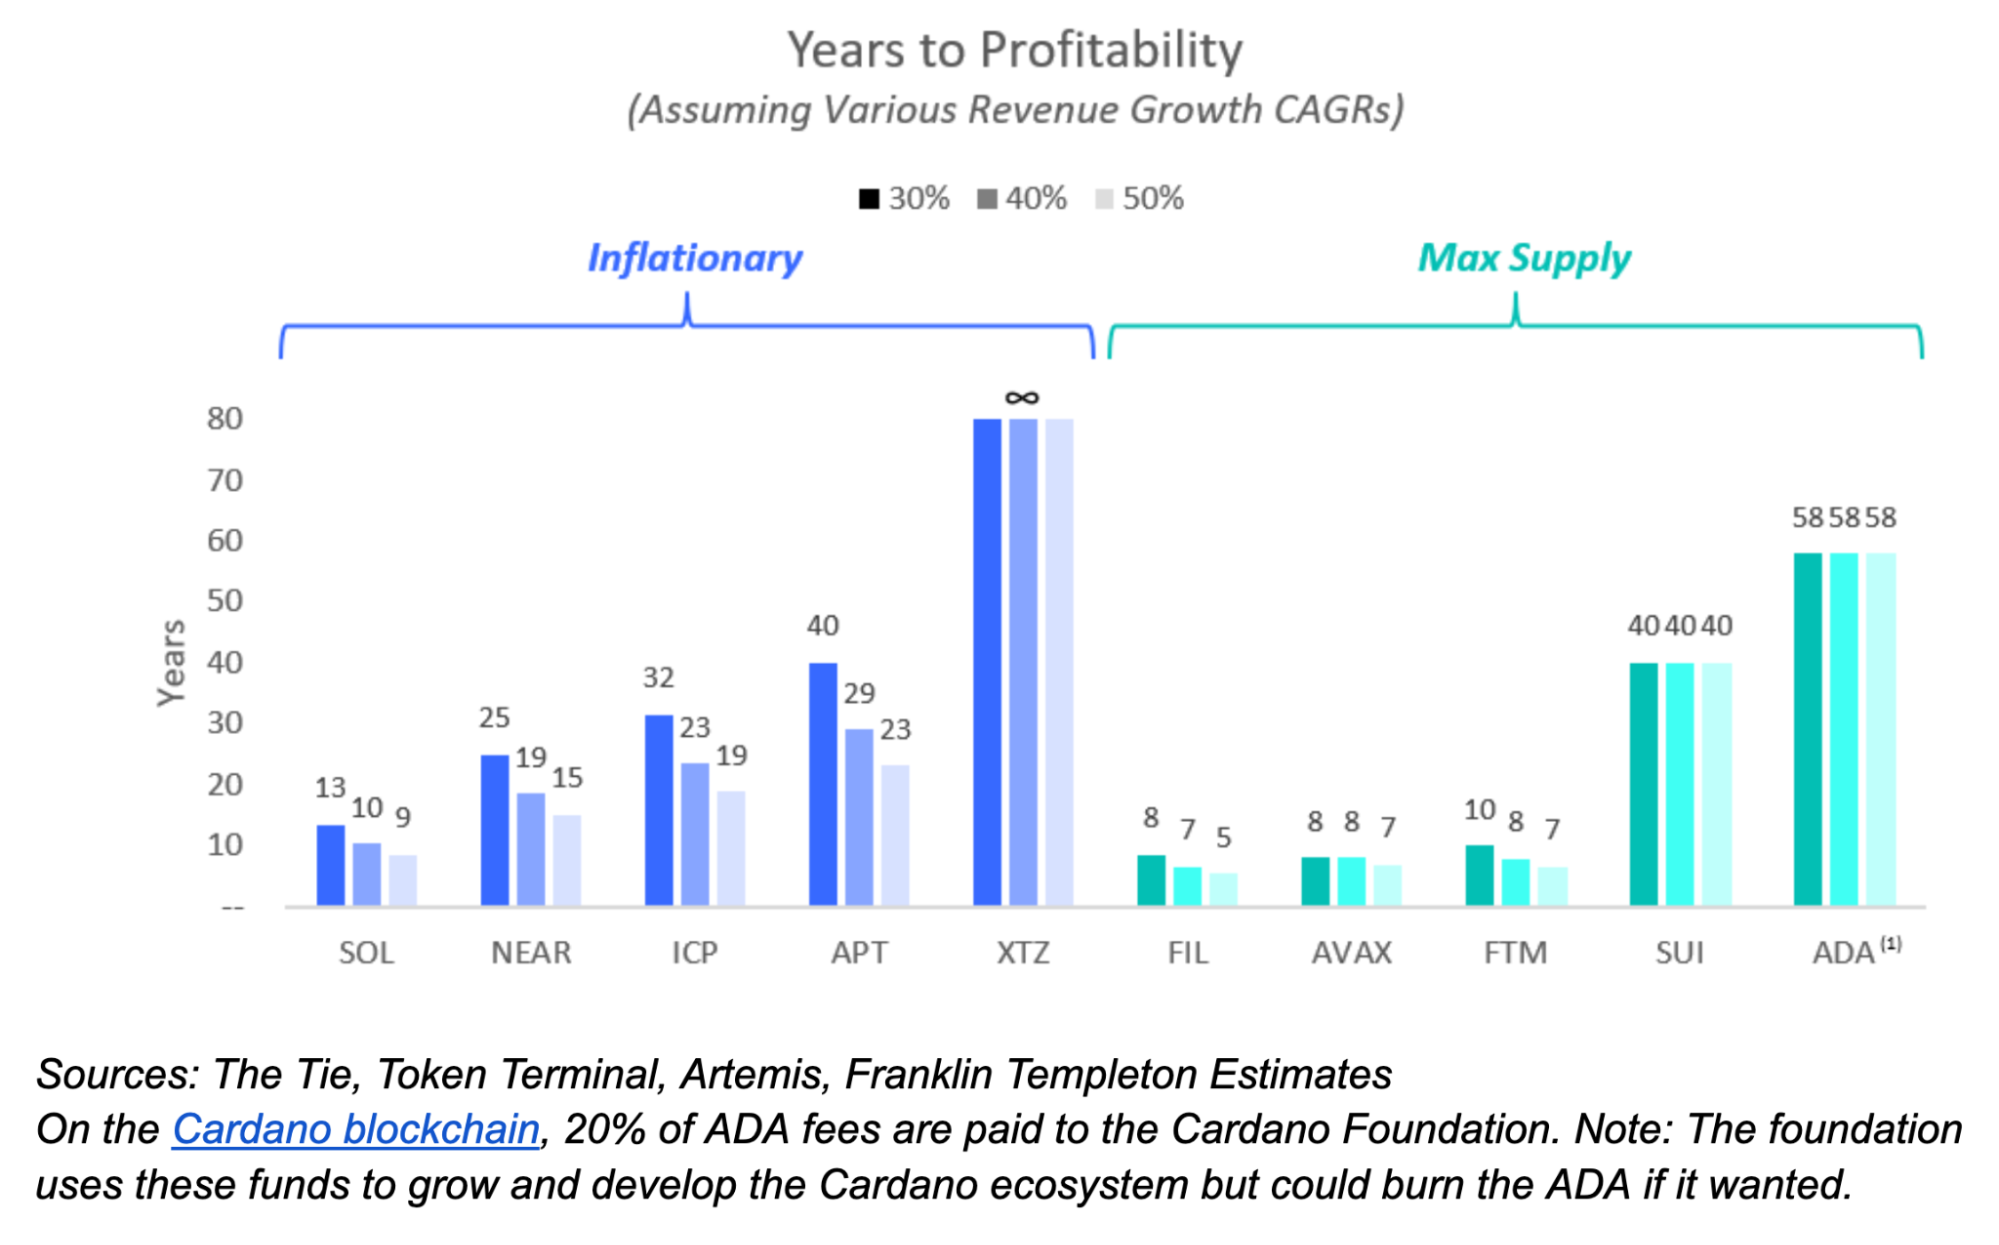
In comparing YTP across blockchains, it’s helpful to group the L1s by whether they have an inflationary tokenomic model or a max supply model, because with the latter, an L1 might “break even” simply because the chain’s fixed supply was reached (as modeled for SUI or ADA). Here’s an analysis for multiple blockchains, with Ethereum and Binance Smart Chain excluded because they are already profitable:

Then, by using the same set of growth rate assumptions for each chain (we calculated future CAGRs of 30%, 40% and 50%), we can make comparisons across chains and explore more deeply what drives YTP. For example, while APT has a high YTP, this is partially because the chain is relatively new and therefore its revenues are smaller than those of other more established chains. SOL has modest inflationary schedules compared to blockchains like NEAR or ICP. In all examples, a blockchain’s ability to burn tokens (and provide some kind of offset to new emissions) is helpful for managing YTP.
In conclusion, YTP serves as a crucial metric in evaluating the profitability and sustainability of L1 blockchains. By carefully designing tokenomics (inflationary or max supply), balancing supply dynamics and incorporating burn mechanics, L1 blockchains can aim to reduce YTP and build a more sustainable blockchain economy.
Edited by Nick Baker.


