7x April’s ATH: Bitcoin Transactional Volume Reaches $700 Billion in a Week
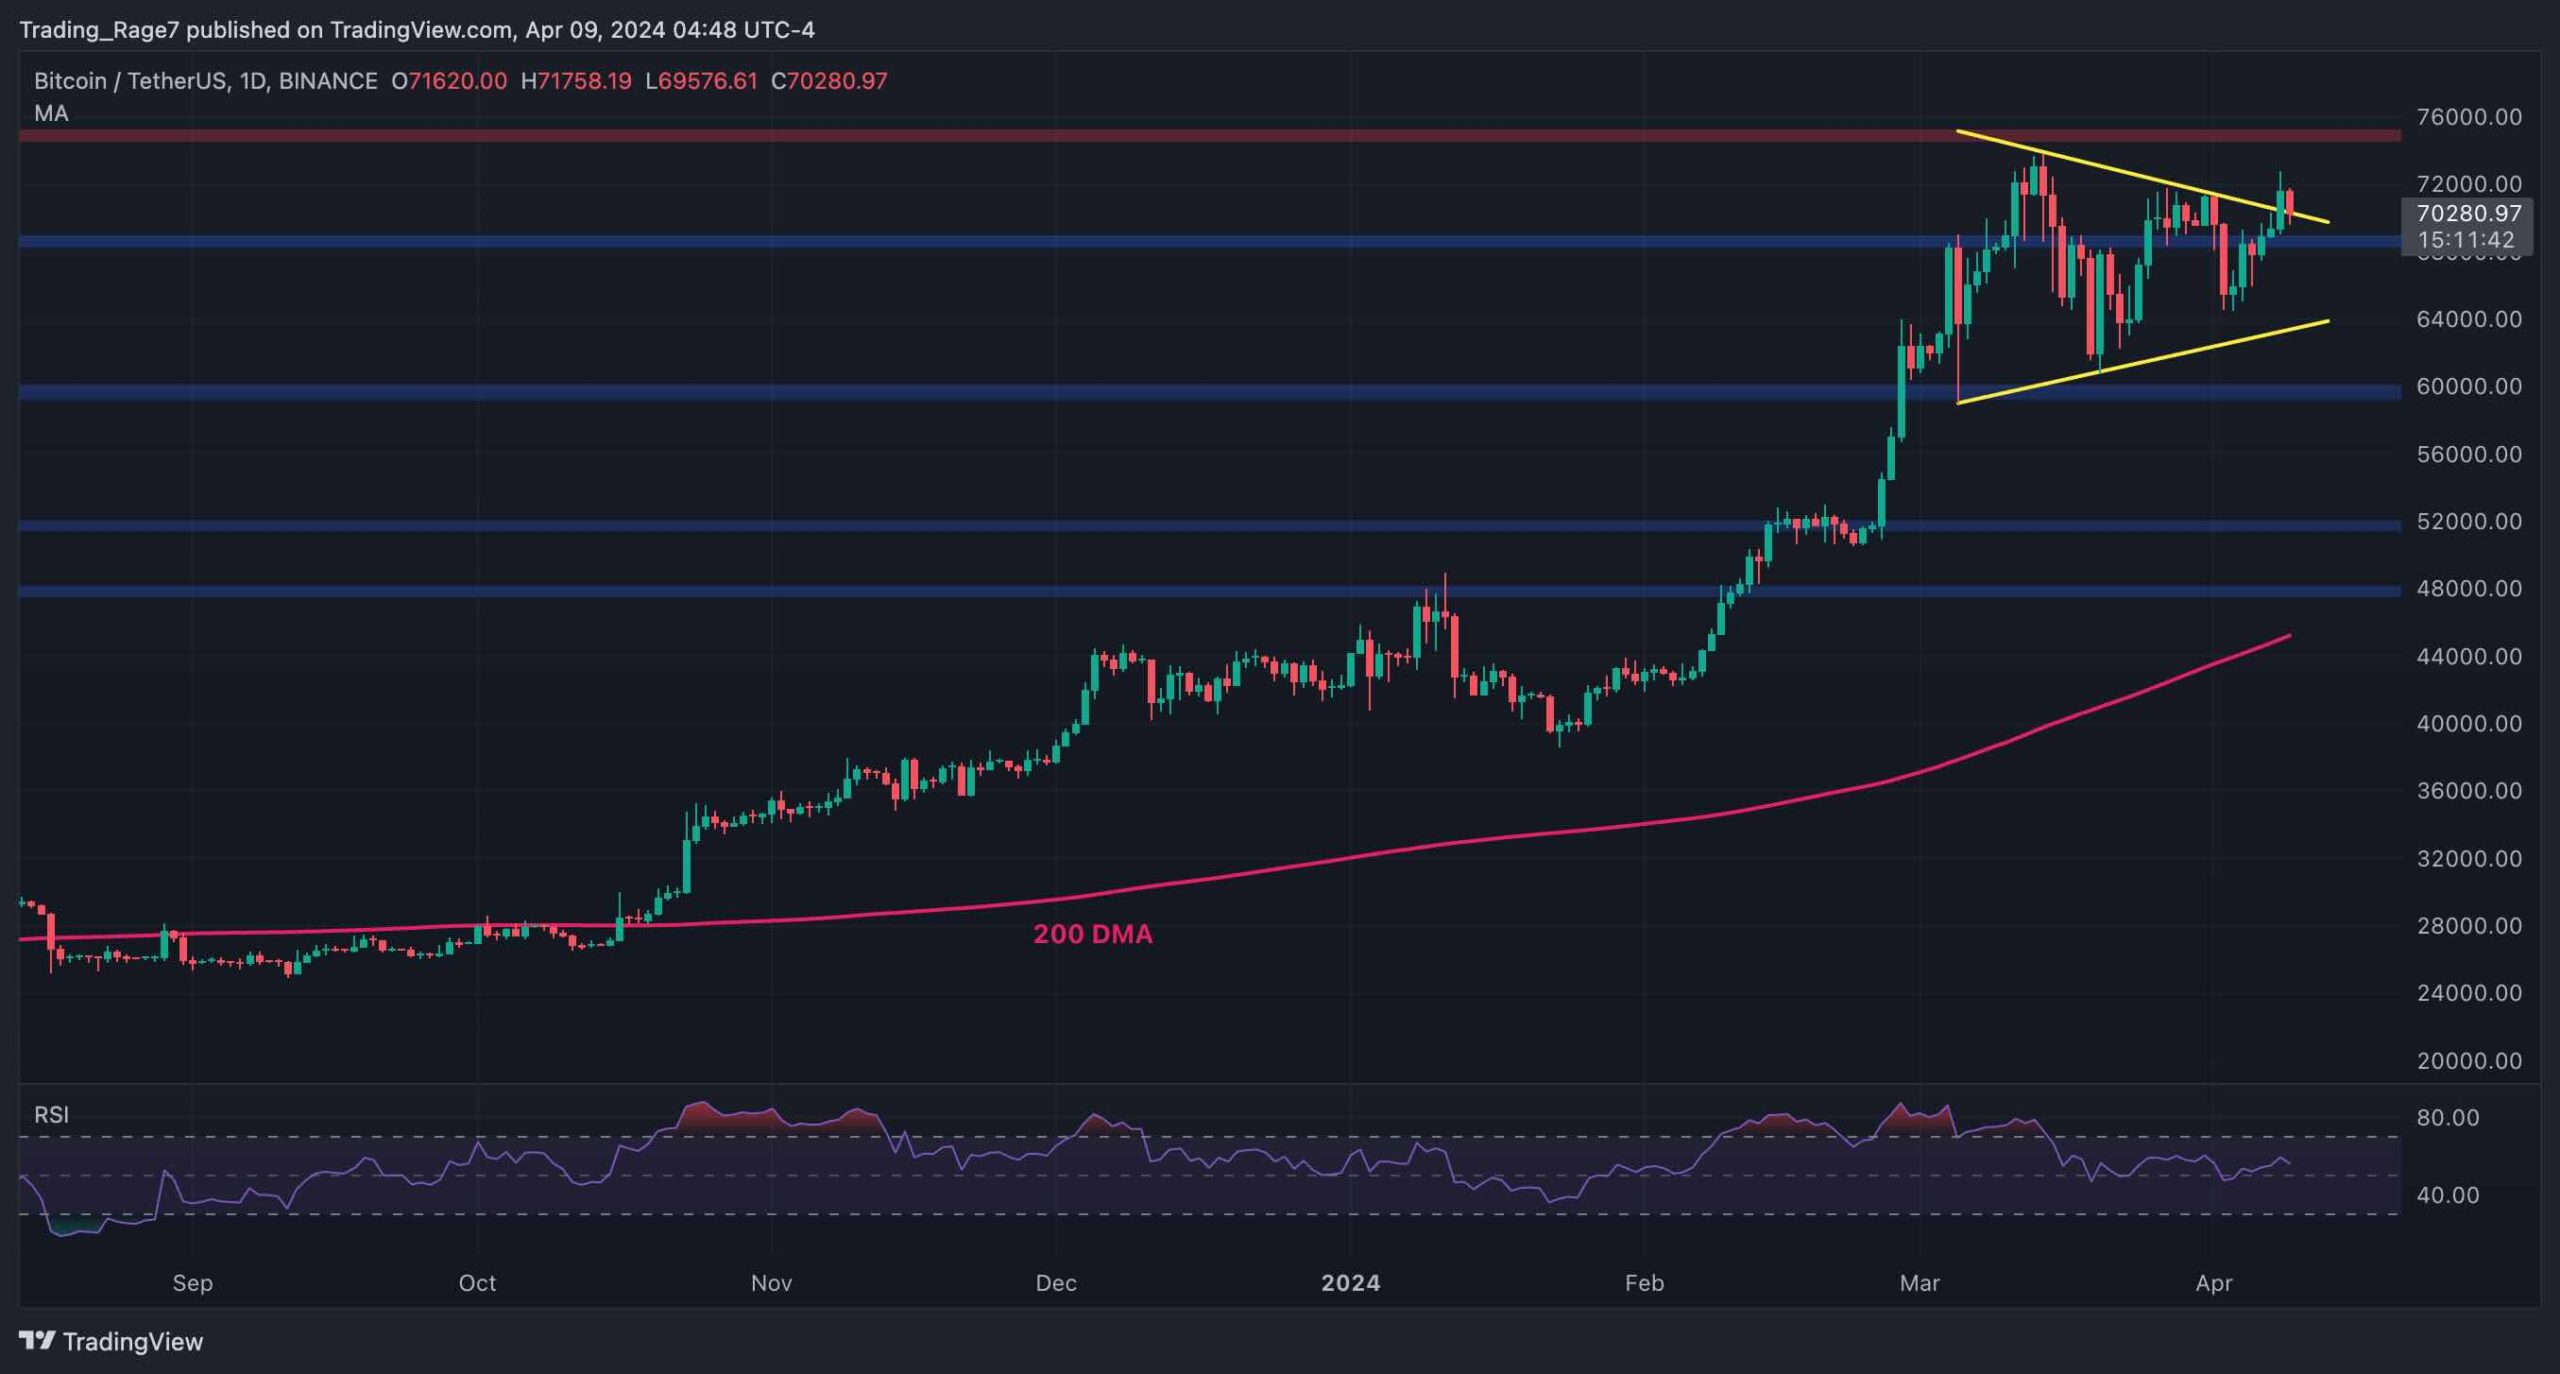
There’s been plenty of comaparisons of Bitcoin’s price action now and in April when the cryptocurrency reached its previous all-time high.
Research firm IntoTheBlock now points out a staggering difference in Bitcoin’s transactional volume between the two periods.
$700 Billion Weekly Transactional Volume
According to the research firm, Bitcoin’s on-chain volume reached over $700 billion transacted, which presents an increase upwards of 7x compared to April.
In addition, the company notes that most of the volume came from transactions that were worth over $100,000.
Going forward, there’s seemingly less speculation in the market.
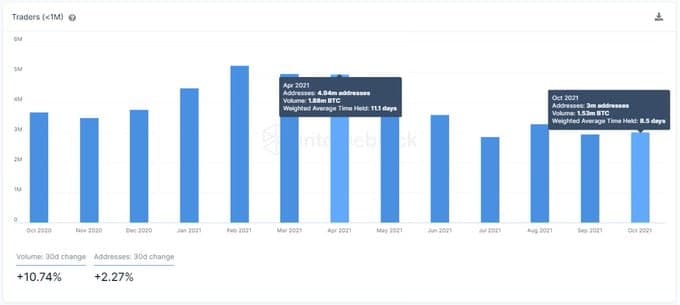
By tracking addresses that hold BTC <30 days, we can measure new money flowing into the market.
From Jan to April, Bitcoin saw a massive surge in short-term interest by retail traders, In this new ATH, the number of traders has decreased by 39.3%.
What Else Is Different in Bitcoin’s Price Action?
As CryptoPotato reported earlier, there are quite a few things that are different when comparing Bitcoin’s price action now and during April’s peak.
Right off the bat, there are no serious signs of retail investors flocking to the market. This means that there’s no FOMO yet – something that usually happens when the cycle is closer to its top. The market is also not so overleveraged as it was back then.
In April, long-term holders were taking profits at an average of an 8X leverage, and now they’re doing so at an average of 3X leverage – a meaningful decline.
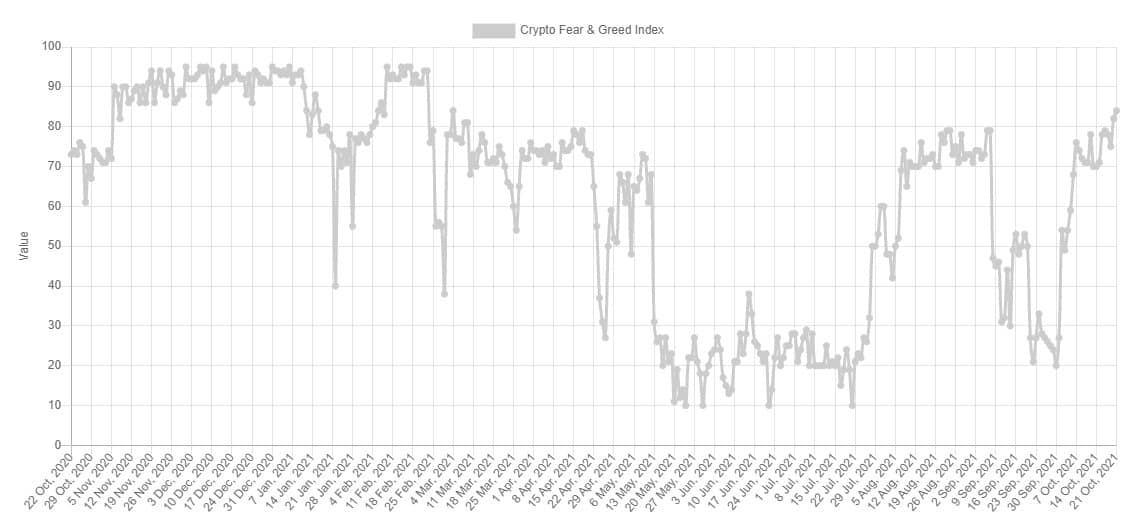
On the other hand, though, the crypto fear and greed index shows that we’re currently in a state of extreme fear, and the indicator appears to be higher than what it was in April.
In any case, it’s advisable to remain cautious, especially in the near term, as the days around forming a new all-time high are usually riddled with volatility.


