75% of Bitcoin Hasn’t Moved in 6+ Months, Signaling Strong HODLing Trend
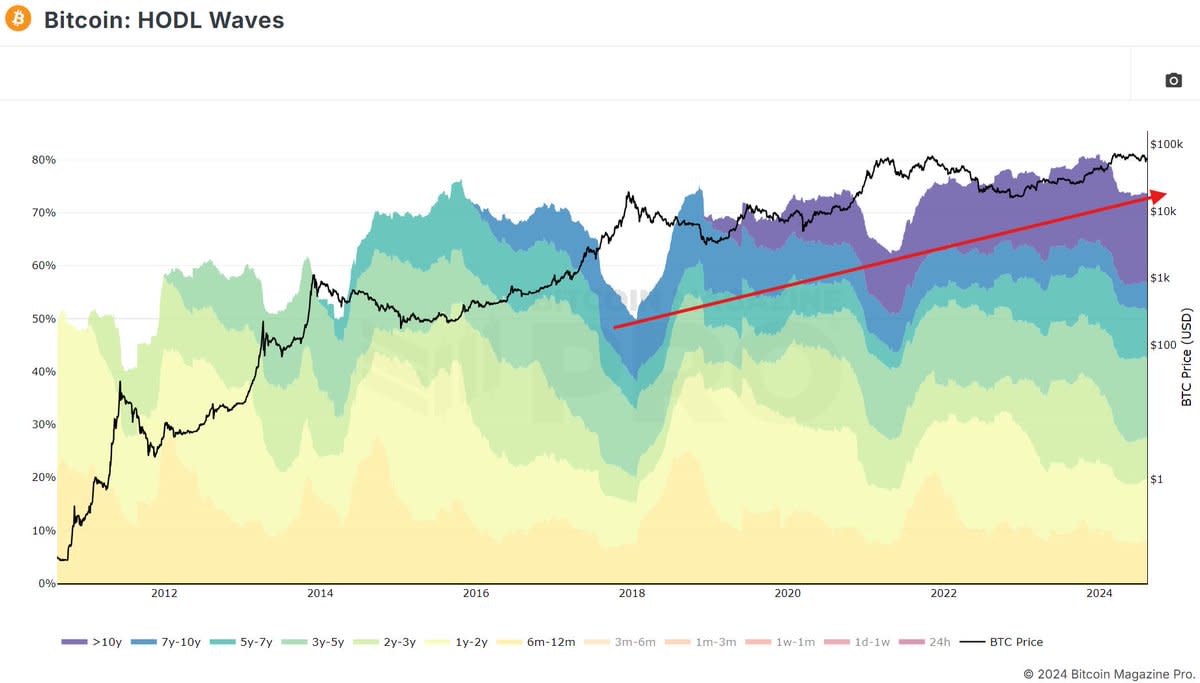
Recent data from Bitcoin Magazine Pro shows a significant trend among Bitcoin holders: nearly 75% of all circulating Bitcoin has remained dormant for over six months. This strong HODLing behavior reflects a steadfast belief in Bitcoin’s long-term value, despite market fluctuations.
Bitcoin Magazine Pro X
The “HODL Waves” chart, a tool that visualizes the age of Bitcoins based on when they last moved, illustrates how various groups of holders react to market conditions. The dominance of older coins (those held for 6 months or more) suggests that long-term investors are increasingly holding onto their Bitcoin, possibly anticipating future price increases.
This trend of HODLing is significant because it indicates a reduced supply of Bitcoin available for trading, which could lead to increased price stability or even potential price appreciation as demand grows. The data also highlights the contrast between short-term traders and long-term investors, with the latter group—often considered ‘smart money’—likely to hold their positions during periods of market volatility.
For new Bitcoin investors, this trend emphasizes the potential benefits of adopting a long-term investment strategy. Consistently buying and holding Bitcoin over time, rather than attempting to time the market, aligns with the behavior of those who have historically seen the most significant gains holding Bitcoin.
For more detailed information, insights, and to sign up to access Bitcoin Magazine Pro’s data and analytics, visit the official website here.


