$6,550: Bitcoin Charts Suggest New Target for Price Rally
The corrective rally in Bitcoin (BTC) could gather momentum if key resistance above $6,500 is crossed on the back of high volumes, according to technical charts.
The leading cryptocurrency witnessed a symmetrical triangle breakout last week, opening doors for a stronger corrective rally towards $6,800–$7,000.
However, despite the bullish setup, BTC faced rejection near $6,660 on Friday and spent the weekend trading in a sideways manner in the range of $6,350–$6,550. As a result, the immediate bullish outlook has been neutralized.
Further, trading volumes fell to a two-month low of $3.22 billion on Saturday, putting a question mark on the sustainability of the recovery from the recent lows near $6,100.
That said, the corrective move could resume if the cryptocurrency sees a high volume bullish break from the three-day long narrowing price range.
At press time, BTC is changing hands at $6,490 on Bitfinex – down 0.10 percent on a 24-hour basis.
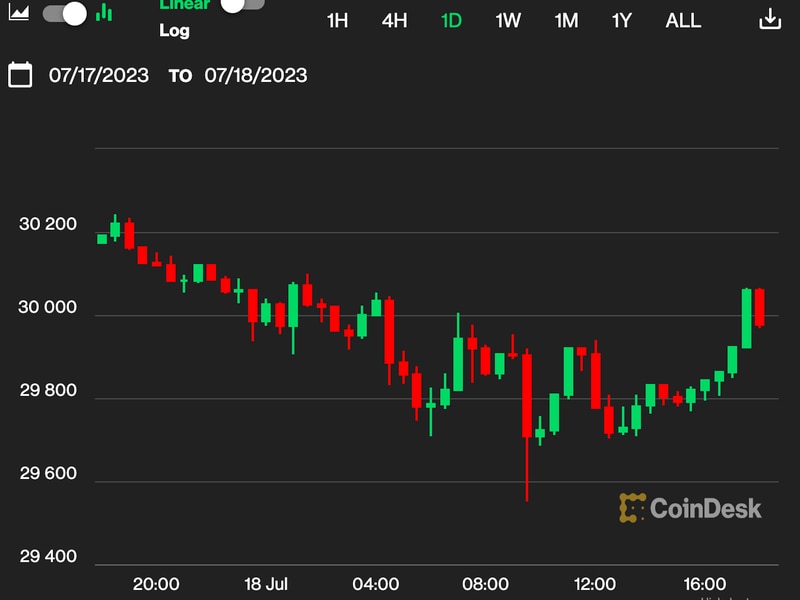
4-hour chart

As can be seen, BTC has charted a narrowing price range over the weekend. A break above $6,540 (triangle resistance) would signal a continuation of the rally from the Sept. 8 low of $6,119.
More importantly, it would strengthen the bullish case put forward by last week’s bullish relative strength index (RSI) divergence and symmetrical triangle breakout.
On the other hand, a break below $6,380 (lower end of the narrowing price range) would signal an end of the corrective rally.
Daily chart

Over on the daily chart, the bullish crossover between the 5-day and 10-day moving averages (MA) indicates the path of least resistance in on the higher side. So, the cryptocurrency is more likely to extend the corrective rally in the short-run.
View
- A high volume move above $6,540 (upper end of the range) could yield a sustained rally toward $7,000 (psychological hurdle). On the way higher, BTC may encounter resistance at $6,710 (50-day MA) and $6,750 (100-day MA).
- A downside break of the narrowing price range would mean the corrective rally from the low of $6,119 has ended and that level could be put to test again.
Disclosure: The author holds no cryptocurrency assets at the time of writing.
Bitcoin image via Shutterstock; Charts by Trading View
Join 10,000+ traders who come to us to be their eyes on the charts and sign up for Markets Daily, sent Monday-Friday. By signing up, you agree to our terms & conditions and privacy policy
The leader in blockchain news, CoinDesk is a media outlet that strives for the highest journalistic standards and abides by a strict set of editorial policies. CoinDesk is an independent operating subsidiary of Digital Currency Group, which invests in cryptocurrencies and blockchain startups.