3 Reasons Bitcoin Has Rallied Over 60% in Just Two Months
3 Reasons Bitcoin Has Rallied Over 60% in Just Two Months
Bitcoin (BTC) has chalked up a stellar price rally in the past two months, reaching 33-month highs close to $16,000.
The uptrend began in early September after buyers bought a dip below $10,000, and gathered pace in the second half of October.
Last week, prices reached a high of $15,971, a level last seen in January 2018. That’s a 63% price gain in eight weeks, according to CoinDesk’s Bitcoin Price Index.
Over 2018 and 2019, bitcoin often languished below $10,000, struggling to recover from a crash that followed the late 2017 surge to record highs near $20,000.
So, what’s behind the rapid gains in recent weeks? Here are three of the primary factors driving the bull market:
1. Increased institutional participation
“Over the past eight weeks, we have seen various notable public companies and hedge funds enter the cryptocurrency market with sizable deployment of capital,” Matthew Dibb, co-founder, and COO of Singapore-based Stack Funds said.
On Sept. 15, listed business intelligence firm MicroStrategy (NASDAQ: MSTR) announced the purchase of $250 million worth of bitcoins, and three weeks later, payments company Square (NYSE: SQ) also disclosed its investment in the bitcoin market.
In October, leverage in the derivatives market was also skewed bullish, with institutions holding record long positions in bitcoin futures listed on the Chicago Mercantile Exchange.
The increased institutional participation likely created upward pressure on prices. Further, it buoyed broader market sentiment and likely prompted more buyers to join the market.
The number of bitcoin whale entities or – clusters of addresses held by a single network participant holding at least 1,000 BTC – rose to four-year highs at the end of October. Retail participation increased, too, as suggested by the “accumulation addresses” metric rising to record highs.
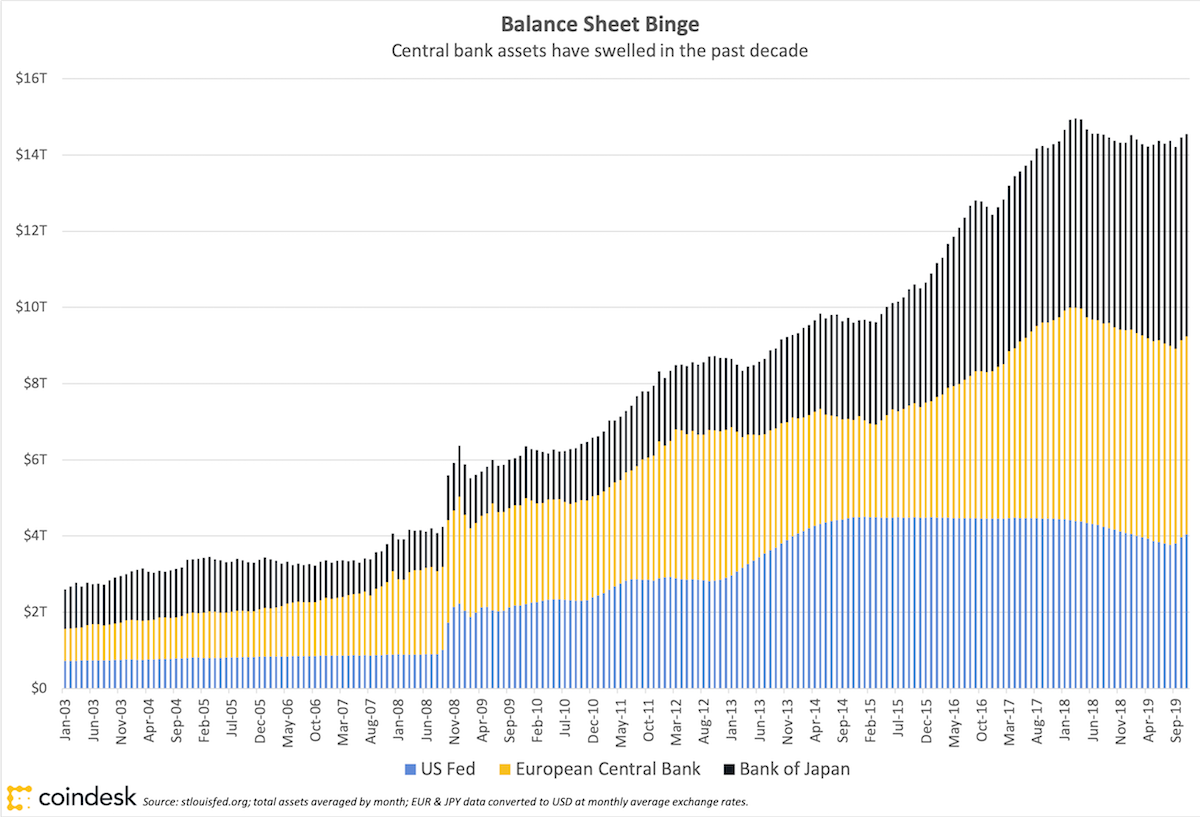
Since the coronavirus pandemic hit, expectations for additional U.S. fiscal stimulus alongside the Federal Reserve’s ongoing inflation-boosting bond purchase programs have triggered fears of a dollar sell-off, and motivated both institutions and retailers to put at least some money into bitcoin.
“The talks of further stimulus efforts has put bitcoin on the map as a quasi-safe haven, possessing many of the store-of-value qualities of gold, despite its relatively [brief] existence,” Dibb said.
2. Supply crunch
Large spot buyers, mostly institutions, have created a shortfall in bitcoin liquidity, pressuring prices to the higher side.
“Between Grayscale’s GBTC trust, MicroStrategy and the influx of other large spot buyers, the supply of bitcoin is beginning to look more scarce,” Dibb said. Grayscale is owned by CoinDesk’s parent firm, Digital Currency Group.
Further, retail investors took direct custody of their coins by moving them from exchanges to their own wallets, adding to the drying up of sell-side liquidity. The total number of bitcoins held on cryptocurrency exchanges has fallen 9% to 2,404,788 BTC in the past two months, according to Glassnode data.
The decline in exchange balances is indicative of strong holding sentiment in the market.

3. Technical breakout
Bitcoin’s bullish bias strengthened following the cryptocurrency’s convincing break above $12,500 in the third week of October.
Back then, many analysts had pointed to $12,500 as the level to beat for the bulls. That’s because the cryptocurrency had declined sharply following a rejection near $12,500 in August.
“The real resistance level is around $12,500-ish, so, until a meaningful breakout above that level, nothing is done,” David Lifchitz, chief investment officer at ExoAlpha, told CoinDesk on Oct. 20.

Indeed, the eventual breakout above $12,500 looks to have invited stronger chart-driven buying pressure.
Bitcoin ended the third week of October above the key hurdle and remained bid in the following two weeks. Now support, $12,500 hasn’t been tested since.
At press time, bitcoin is changing hands near $15,390, representing a 113% year-to-date gain.
Disclosure: The author holds small positions in bitcoin and litecoin.


