3 Possible Reasons For Bitcoin’s Price Crash to $38K
Bitcoin’s price took a beating in the past few hours. Everything was seemingly going well over the past few days. BTC surged to a high above $43K yesterday, and it was testing the major resistance area around $44K.
Unfortunately, it was then that the price got rejected and nuked all the way down to $38K (on Binance). As CryptoPotato reported earlier today, this saw over $700 million worth of liquidated positions in less than 24 hours.
Now, let’s have a look at three possible reasons for which the market bloodbath may have happened.
Macro Selloff and High Correlation
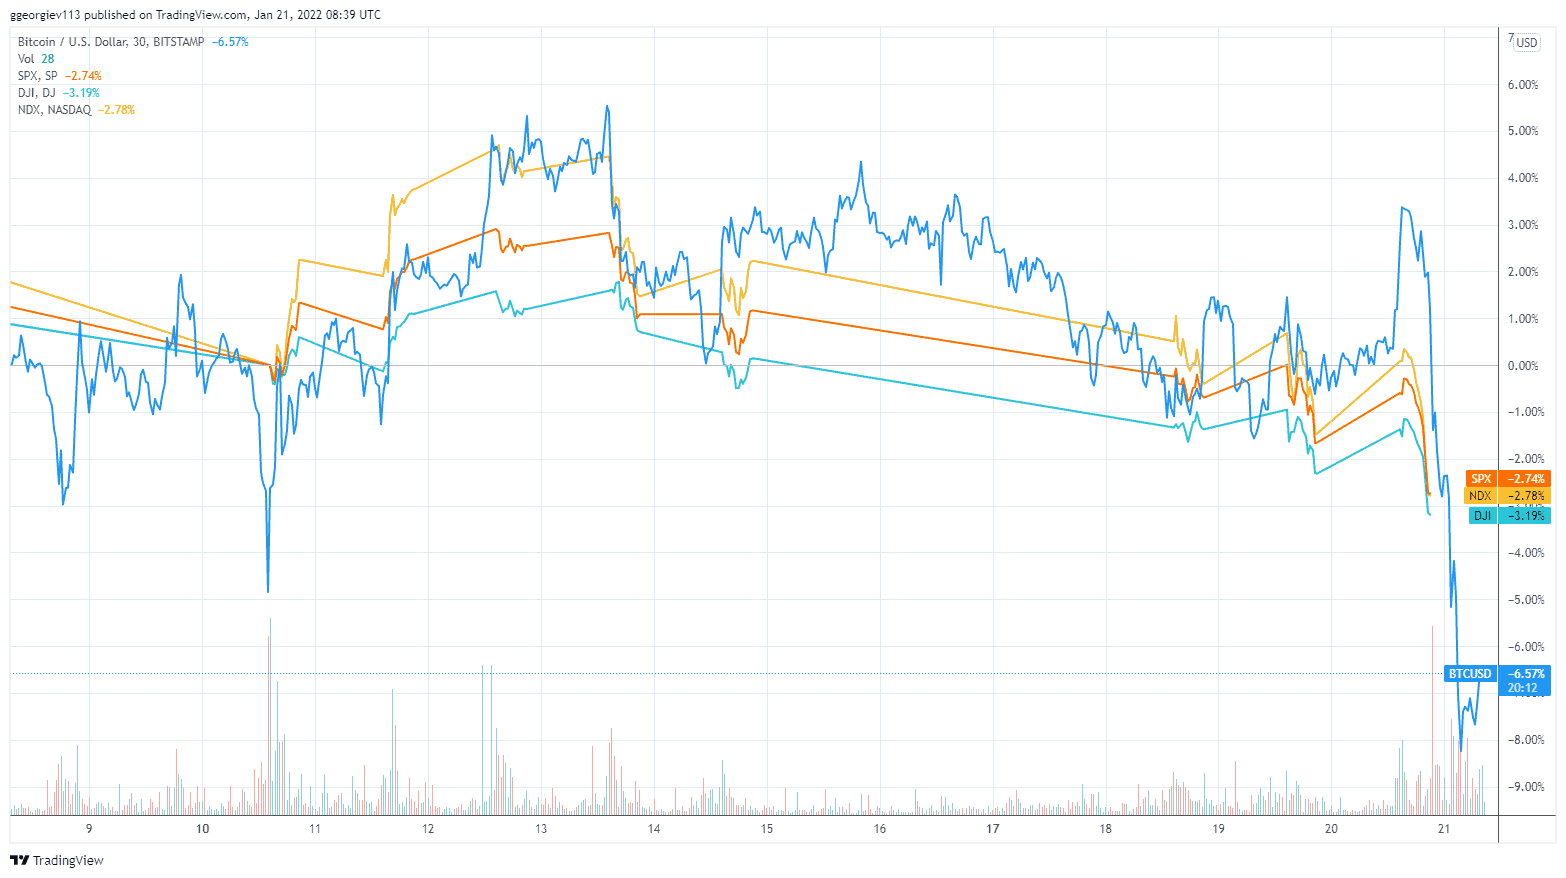
The S&P 500 closed yesterday’s trading session down 1.1%. The NASDAQ Index is down 1.3% on the same time frame. The Dow Jones is down 0.89%.
If that’s not enough, the derivatives market also took a hit. CNBC reported that the Nasdaq 100 futures index tumbled following a disappointing earnings report from Netflix. The shares of the streaming giant dropped over 19% during the extended trading session on Thursday once the document was out, showing a slowdown in the growth of its subscribers.
The S&P 500’s close below 4,500 yesterday was the first one since October 18, 2021. Speaking on the matter was Scott Redler of T3 Live, who said:
The market has been flashing faulty signals for the past few weeks and it seems as if the broader indices are finally breaking down.
Meanwhile, Bitcoin’s price has been tightly correlated with that of traditional indices, and the latest tumble was no exception:

BTC Exchange Inflows Increased Before the Crash
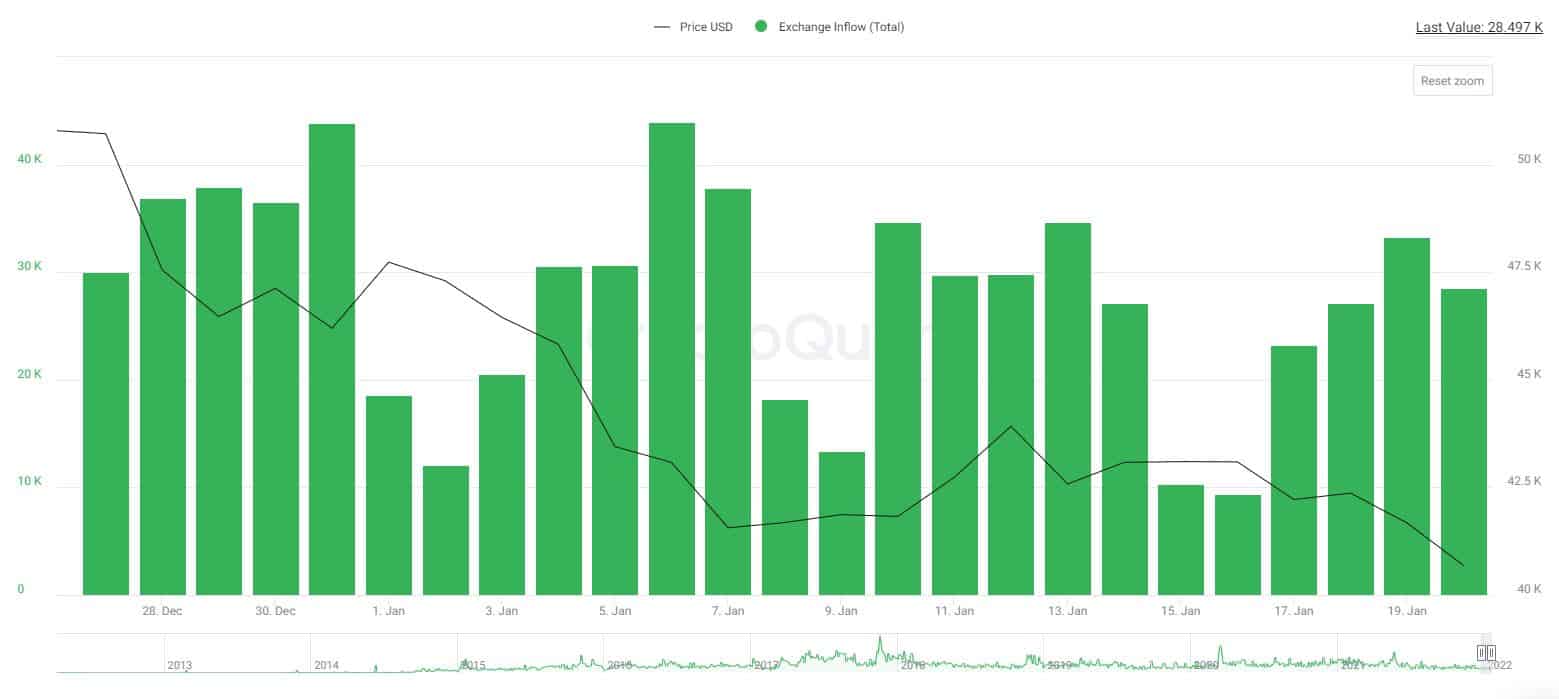
One indicator of potential selling pressure is the total inflows of BTC in exchanges. The more BTC sits on exchanges, the highest the potential selling pressure typically is.
Data from CryptoQuant reveals that the total exchange inflows were on the rise in the days leading to the crash:

The number has been going up since January 16 and increased with the price, indicating that BTC was moved to exchange wallets with the intention to sell.
$39K Put Options on Deribit With Highest Open Interest
As we reported in yesterday’s Bitcoin price analysis, the puts for the $39K strike price on Deribit had the highest open interest among put options.
For those unaware, put options profit when the price goes down. The calls for the $44K strike price had the highest open interest amongst call options, on the other hand.
It’s worth noting that there’s approximately $538 million worth of Bitcoin options contracts that will expire on Deribit today, and the max pain scenario is for the price to be at $43K when this happens.


