3 Possible Reasons For Bitcoin’s $6K Weekly Crash
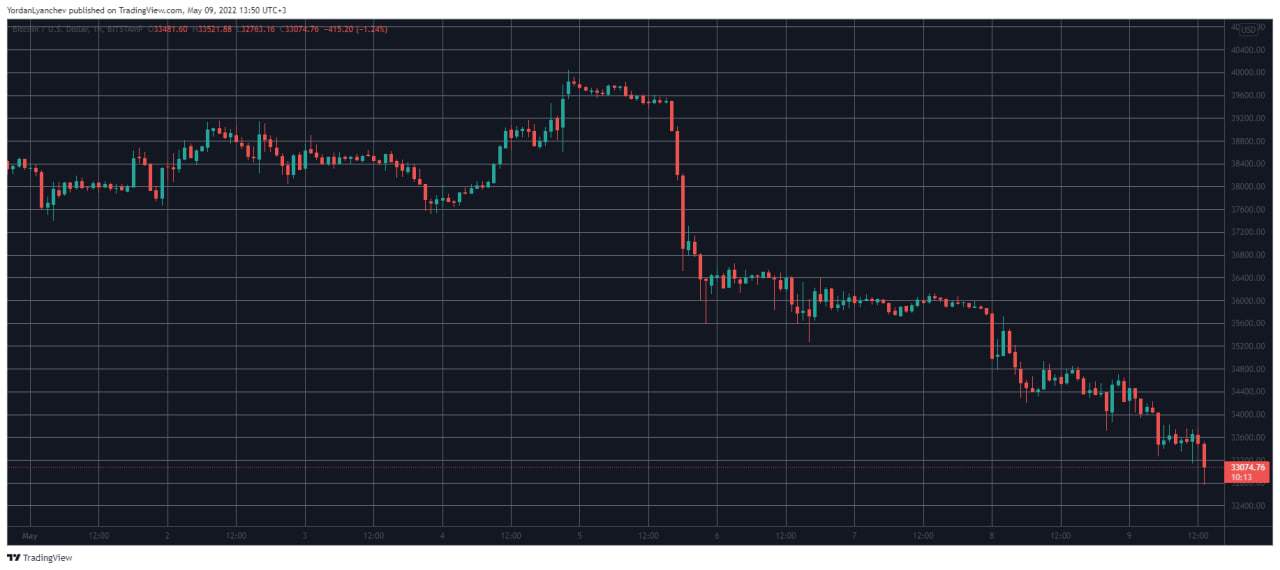
Bitcoin’s price has been in shambles for the past few days, and it has lost a total of $6K off its dollar value since May 5th.
This represents a decrease of more than 16.5% in the span of four days. Many other cryptocurrencies followed suit, resulting in a whopping $300 billion hit for the total cryptocurrency market capitalization.

More importantly, BTC has closed six consecutive weeks trading in the red – something that hasn’t happened in 8 years. With this in mind, we take a closer look at some of the possible reasons for the downturn.
Global Macroeconomic Uncertainty
2022 has so far shaped like a year of severe market volatility where many decisions made in the past will yield consequences – albeit for the better or worse. A case in point is the COVID-19 pandemic, and many governments incentivized their struggling economies through numerous incentive packages. This created what many referred to as a cycle of infinite money printing, resulting in sky-high inflation rates.
Although the numbers for April are not yet in, last month, the United States Bureau of Labor Statistics (BLS) reported that the Consumer Price Index reading hit 8.5%, breaking yet again another 40-year high.
To battle the rising inflation, the Federal Reserve has begun increasing interest rates, with the latest hike amounting to 0.5%.
The overall uncertainty caused by rising inflation has taken its toll on both retail and Wall Street investors, as markets bleed out continuously throughout the past weeks, where intensity has only increased in the last few days.
For example, the S&P 500 is down over 4% since May 5th, the Dow Jones Industrial Average (DJI) is down almost 6%, while NDX is down 6.2%.
While distinct in their nature, cryptocurrencies remain in notable correlation to traditional stock markets and are widely perceived as a risk-on asset. In times of turmoil, these tend to be liquidated first – hence the tumultuous price action of late.
Exchange Inflows Skyrockets, Big Players Selling
Data from Glassnode revealed that the exchange inflow volume adjusted for a 7-day moving average reached a 3-month high of 1,755.021 BTC today.
#Bitcoin $BTC Exchange Inflow Volume (7d MA) just reached a 3-month high of 1,755.021 BTC
Previous 3-month high of 1,729.605 BTC was observed on 08 May 2022
View metric:https://t.co/1S6EbDkdOO pic.twitter.com/8kSJPOLJXW
— glassnode alerts (@glassnodealerts) May 9, 2022
This usually suggests that whales are exiting the market by selling their coins, and it could be interpreted as preparation for a longer downturn.
Supporting this is also a report from another analytics resource – CryptoQuant. According to an update from today, big players and whales which sent from 10 to 10K BTC to exchanges distribute more than retail investors – interestingly, more nervous behavior than retail.”
The analyst also concluded that this might be the result of bigger players unwinding crypto-related risk-on positions to secure their positions in stocks.
Glassnode also revealed that over 26.5K BTC “worth of open interest was added to the market” during the increase between May 4th and May 5th, but almost all of it (around 25K BTC) has been closed out during the subsequent sell-off.
Technicals in Turmoil
Technical indicators are also not particularly bright for BTC. As CryptoPotato reported earlier today, the cryptocurrency closed six subsequent weeks in the red and opened the 7th one decreasing as well.
The market hasn’t seen this in 8 years, and it’s surely a testament that investors are scaling out of their positions.
Another metric to consider is the Fees to Reward Ratio. Data shows that it has dropped significantly ever since the previous all-time high – an indication of an impending bear market, according to analysts.

The number of addresses in loss – adjusted for a 7-day moving average – also reached a 2-year high.
The zone at around $37,000 was considerable support where many investors provided plenty of liquidity, but now that’s gone, buyers might be looking at the $30K area next.
All of the above has driven the market to a state of extreme fear. The last time the sentiment was so negative was back on January 25th.


