2023 Aftermath: By How Much Did Bitcoin Outperform S&P 500, NASDAQ, Dow Jones, and Gold?
It was another challenging year as one war continued without an evident conclusion (Russia-Ukraine), and another one broke out in the Middle East. Numerous countries are trying to fight off the increasing inflation, some with bigger success than others.
With just hours left of 2023, it’s interesting to compare the performance of the world’s largest stock market indexes, gold, which typically performs better during uncertain times, and Bitcoin – an asset that has been proclaimed dead numerous times in the past but still keeps coming back.
How Did Traditional Assets Perform in 2023
Starting with perhaps the most well-known US stock market index – the Standard and Poor’s 500. It tracks the performance of the 500 largest companies listed on stock exchanges in the US and is typically regarded as the benchmark that shows the health of the country’s financial state, at least in terms of large corporations.
It began the year at just over 3,820 points and quickly soared to 4,200 before returning to its starting position by March. The bulls stepped up on the gas in the following months, and the index jumped to 4,600 at the end of July. After another retracement, the S&P 500 finished the year strong and ended the last trading day of 2023 on December 29 at 4,769 – close to its all-time high.
In terms of percentages, the S&P 500 finished 2023 with a notable increase of roughly 25%. Although that seems quite impressive, one can easily see that most of the gains came from a few tech-related companies, such as Nvidia (245%).
Taking into consideration the aforementioned tech stocks, it’s logical that the Nasdaq Composite, which tracks mainly such assets, has soared the most from the indexes. In fact, the Nasdaq has outperformed almost all of its competitors with a 44.5% yearly surge that drove it from 10,386 at the start of 2023 to 15,011 at the end of it.
The Dow Jones Industrial Average, on the other hand, averts from tech-related stocks. The index that follows just 30 large US behemoths has increased by 13.74% in 2023 – from 33,136 to 37,689.

What About Gold?
The yellow metal is regarded as the most prominent safe haven asset that tends to outperform the more riskier stocks during turbulent times. The past few years indeed fall into such a category, which has affected gold’s performance and resulted in untypical volatility.
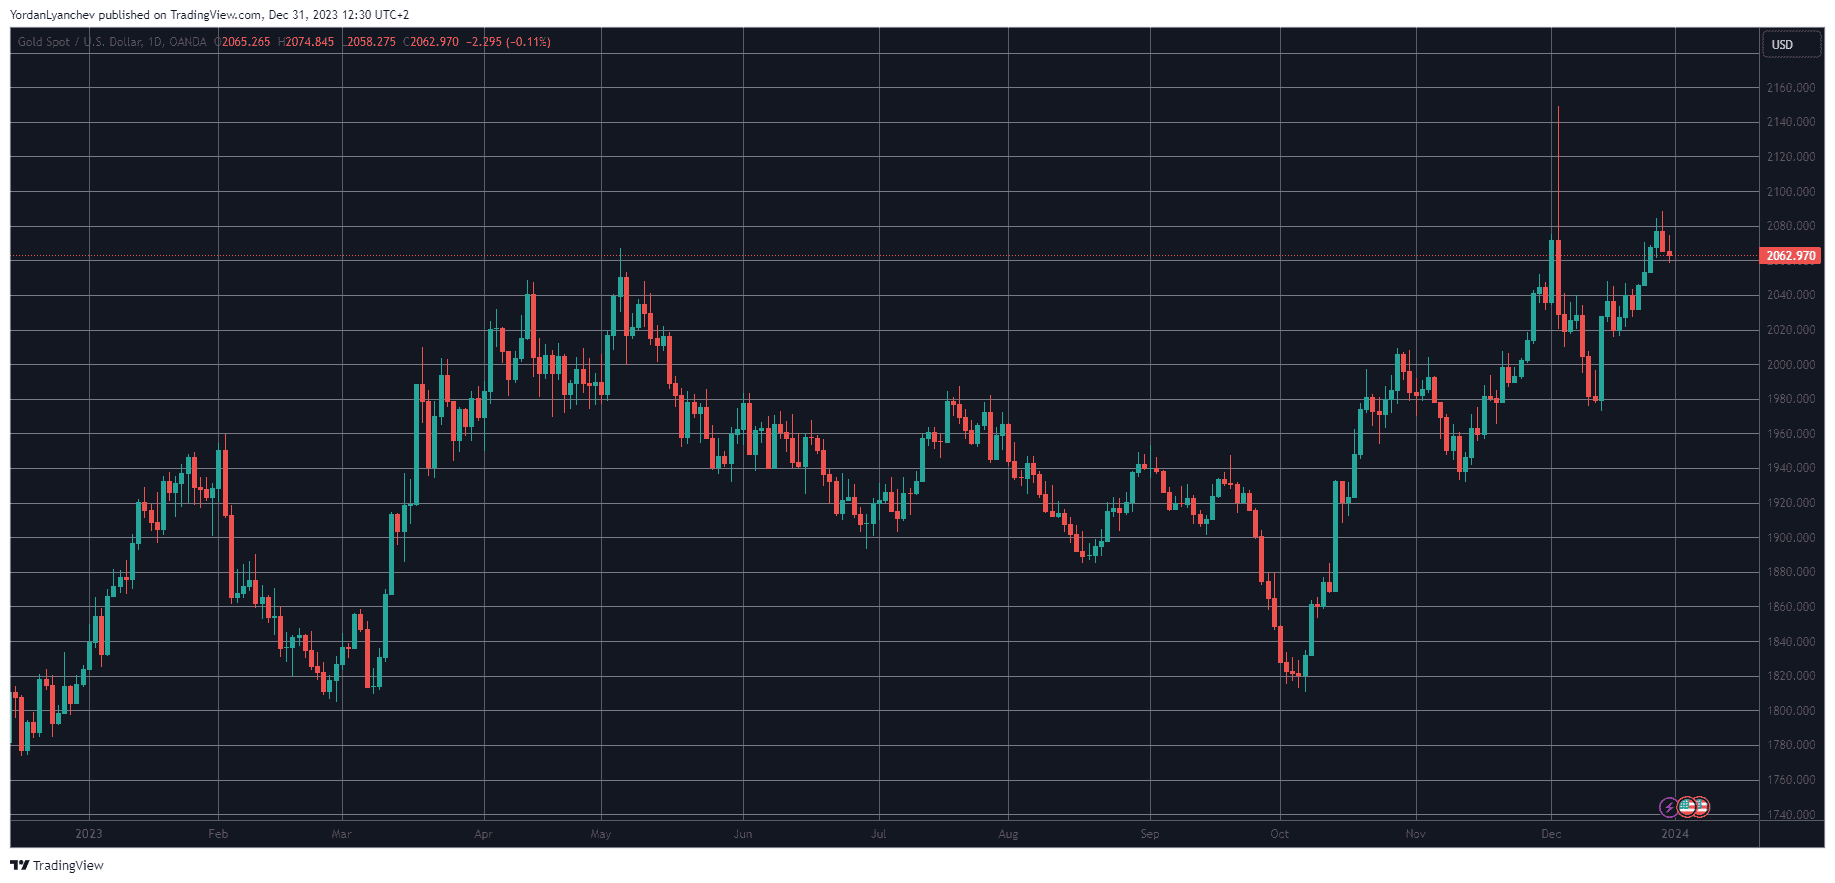
One ounce of gold cost $1,813 on the financial markets at the start of 2023. Similar to most assets, the bullion had a strong spring and soared past $2,000 in April and May. The trend reversed after the summer, and the precious metal found itself dumping hard to its 2023 starting price at the beginning of October.
After the Hamas-Israel war broke out, though, gold went on a tear. Its price against the dollar exploded by over $300 in less than two months and marked an all-time high of $2,150/oz on December 5.
Since then, the precious metal has lost some traction but still ended 2023 above $2,060, charting a yearly increase of 13.73%.

And Then, There’s Bitcoin
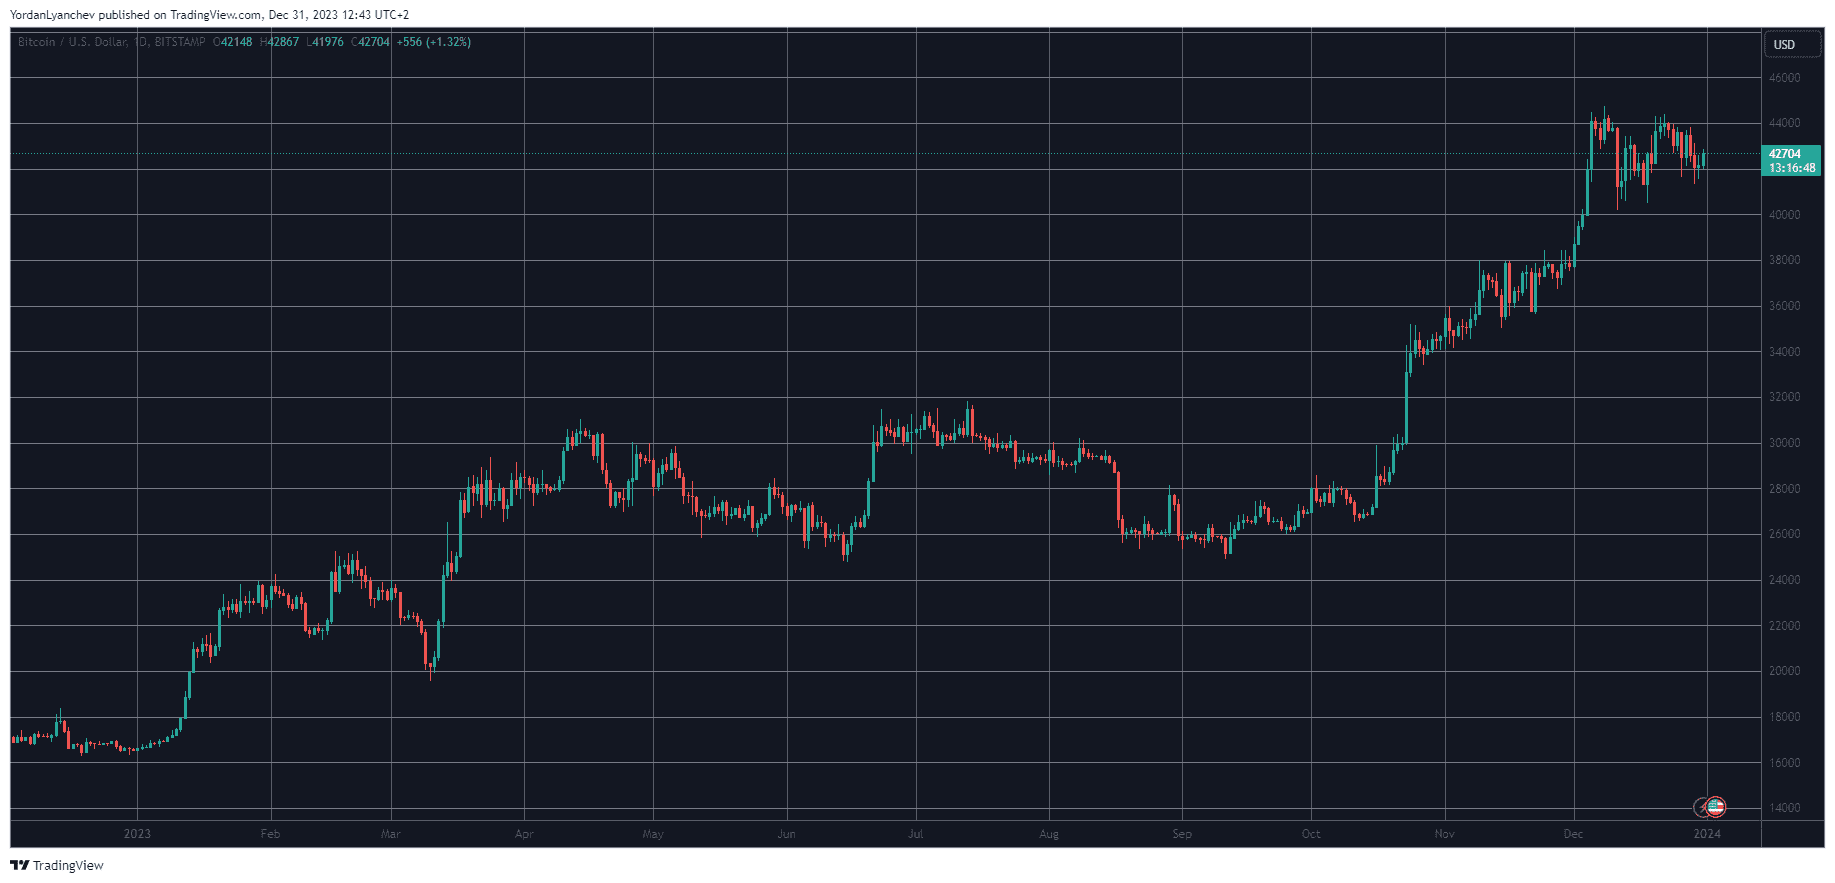
Bitcoin, alongside the rest of the crypto market, had a catastrophic 2022 due to industry collapses and adverse global events. As such, it entered 2023 at around $16,600. It didn’t take long before the asset broke out of its late-2022 nosedive. By January 13, it had soared past $20,000 and hadn’t looked back since, despite a few retracements along the way.
Then came reclaiming the $30,000 level, which was harder than anticipated. In fact, it took BTC several attempts to decisively overcome that level, which finally happened in late October.
Bitcoin kept climbing in the following weeks, which culminated in a price surge to nearly $45,000 in early December. It has lost some ground since then, and even though there’re still some hours left in 2023, it’s safe to assume that BTC will finish the year in a range between $42,000 and $43,000 unless something cataclysmic happens.
As such, Bitcoin’s YTD gains will be somewhere between 150% and 160%. This means that the cryptocurrency will trump all other large traditional finance assets mentioned above by a massive margin.
2024 has all the ingredients to be an even better year for Bitcoin, given the upcoming halving (usually serving as a catalyst for a bull market) and the potential approval of a spot BTC ETF in the States. Nevertheless, it’s worth noting that such an approval could serve as a sell-the-news moment, and history is no indication of future price performances.

The post 2023 Aftermath: By How Much Did Bitcoin Outperform S&P 500, NASDAQ, Dow Jones, and Gold? appeared first on CryptoPotato.


